Investment Thesis
United Rentals (URI 0.00%↑) is an equipment rental provider that offers aerial work platforms, earthmoving equipment, forklifts and a wide range of other light & heavy equipment to construction, industrial and other end markets. URI is the largest equipment rental company in the world. Their market share sits at 16% in North America, while the top 10 have a combined market share of ~40%. Most of their competitors are small subscale regional competitors, and URI has a long list of competitive strengths and advantages over this cohort, which include:
Wider selection of general tools and specialty equipment available for rental
Scale gives them purchasing power over suppliers that many of their small competitors don’t have, and also helps URI get better warranty, spare parts pricing and improved payment terms
National footprint allows them to meet the needs of large customers wherever those customers are located
Industry-leading scale also gives leverage on fixed costs which improves unit economics
Unparalleled data, analytics, and technology capabilities allowing personnel to easily determine availability of equipment, arrange for deliveries, monitor activity levels in real-time and consistently analyze operating and financial data
Geographic and customer diversity which leaves them with limited exposure to any customer or region
M&A expertise and integration capabilities
URI has seen its market share increase to 16% over the last two decades, and as they grow, many of these competitive advantages compound in importance. As consumer preferences change and renting equipment grows in popularity, URI is in a strong position to cost effectively take a greater share of this growing pie, particularly from the long tail of small competitors. My expectations for long-term growth exceed those implied by the current share price.
Most large competitors have copied some URI best practices but are unlikely to effectively replicate many of their competitive advantages, specifically when it comes to the magnitude of its scale and data, analytics, and technology. There does not appear to be any disruptive new competitors with any clear competitive advantages over URI. We believe the industry is sufficiently fragmented that the larger rental companies can continue to outperform overall industry growth.
URI has also built out a leading technology offering “Total Control” which drives a superior customer experience and is an area where competitor offerings are lagging. URI’s Digital Tools collectively allow the company to better capitalize on demand, acquire new customers and generate interest in its portfolio. The company has continued to aggressively grow its Specialty rental solutions business to further differentiate its portfolio relative to the industry. Specialty markets also have less volatility demand and lower penetration rates resulting in a superior growth and margin profile. The solution-oriented nature of specialty markets is differentiated compared to the core rentals business. I don’t think URI receives enough credit for this today and this should continue to be meaningful growth driver in the future.
Lastly, the management compensation framework is robust with long-term compensation tied to ROIC & Revenue metrics. Even annual bonuses remain reasonably well structured including adjusted EBITDA and an Economic Profit measure that incorporates a cost of capital calculation driving management to focus on both profit maximization and optimal capital investment. Equity ownership is low but mitigated in our view due to the overall compensation policy. I would characterize management as strong operators and capital allocators and would continue to expect some accretive M&A into specialty rental equipment markets or ongoing execution of its buyback program over the next 18 months. Excess cash is likely to be returned to shareholders through buybacks, and I expect that they could purchase ~34% of float over the next decade while having lower leverage than targets and growing operating income ~11%/year.
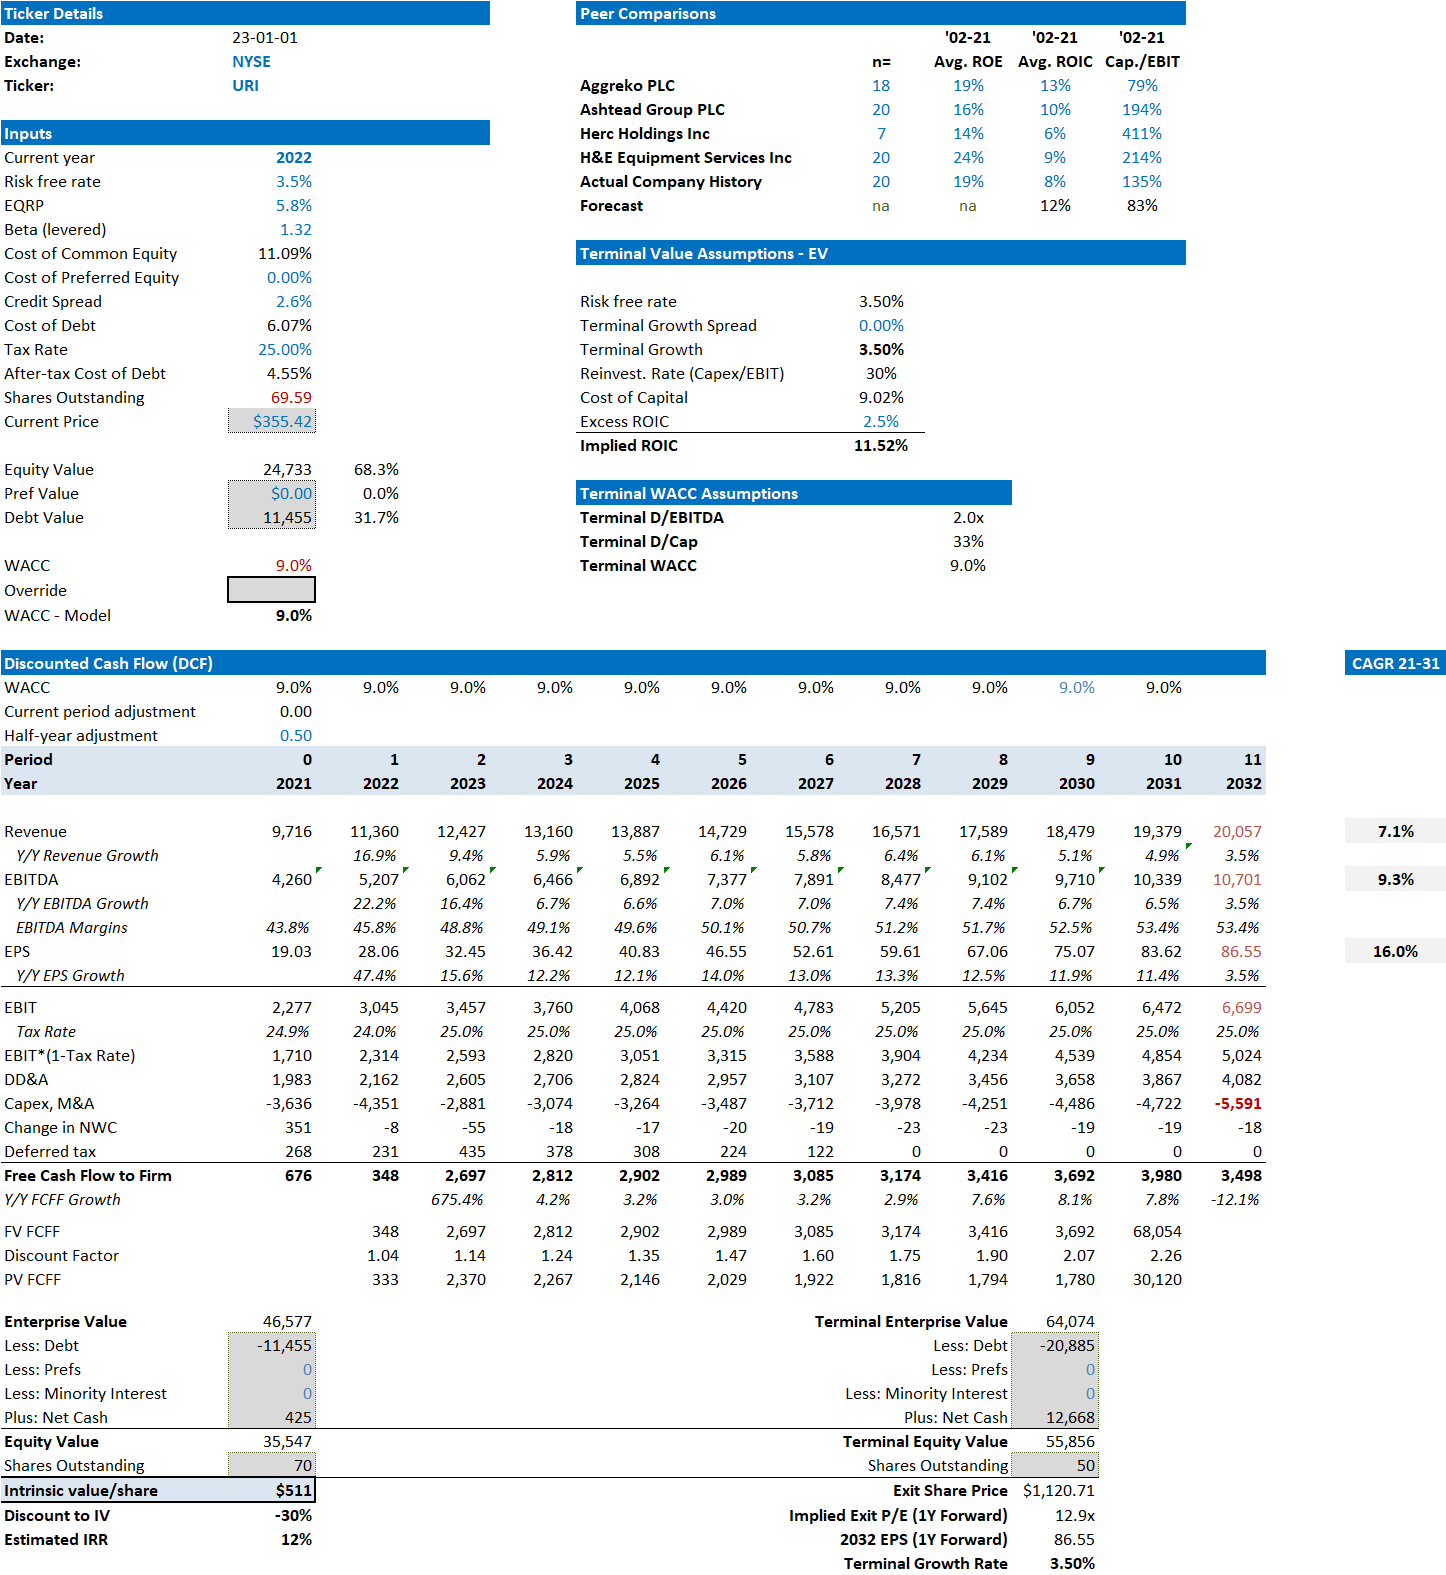
In the base case, I estimate that fair value is $511/share, which is a 34% discount to current price of $355/share, and implies a 10-year TSR of 12%. My bear and bull case scenarios also suggest a relatively narrow range of outcomes that are skewed to the upside ($349/share and $537/share respectively). In my view, the current share price represents a fair price to own a high-quality business that dominates in a fragmented industry - however, better entry points may emerge in the future as the business cycles through the current period of economic weakness.
I’m still figuring things out, so feedback/comments on my assumptions or any of the analysis I have here is appreciated. Always open to the idea that I can be wrong. I can be reached at icemancapital@gmail.com. Please see below for my DCF model which has key assumptions built in.
Introduction to United Rentals
United Rentals (URI) is an equipment rental provider that offers aerial work platforms, earthmoving equipment, forklifts and a wide range of other light & heavy equipment to construction, industrial and other end markets. Exhibit A shows the historical revenue its key reporting Segments and a breakdown of the company’s customer mix in 2021. URI serves its customers through two business segments, General Rentals and Specialty. URI also sells used rental equipment, select new equipment, contractor materials and also provides servicing on select pieces of equipment.
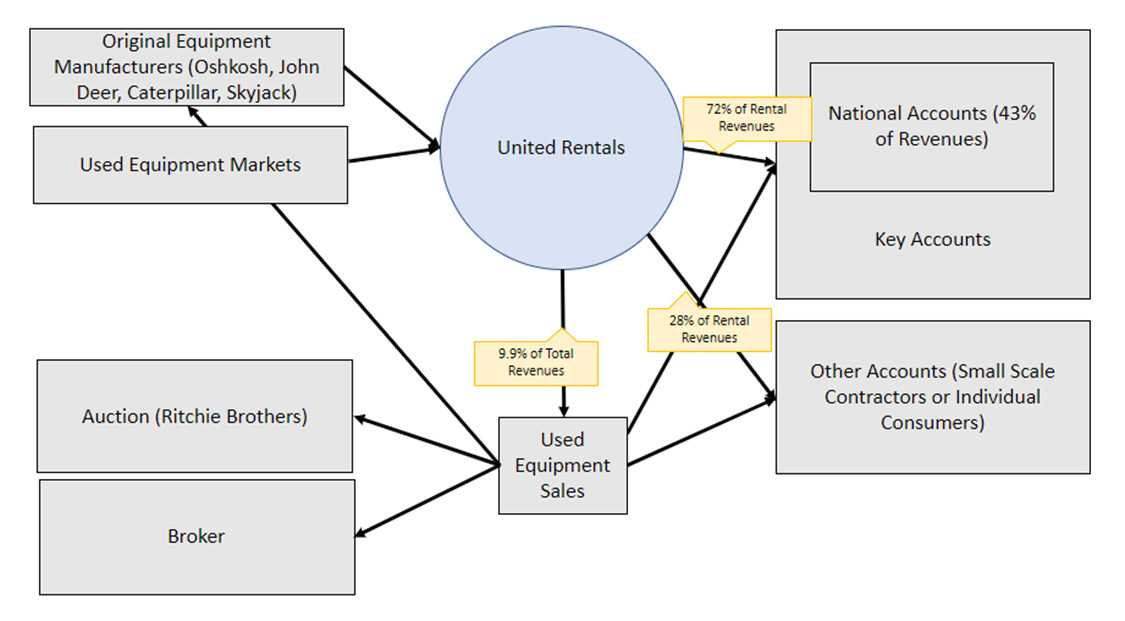
Before we dive into the equipment portfolio of each segment it might be helpful to look at how the business model is set up (Exhibit B). URI starts by acquiring equipment from original equipment manufacturers (OEMs) or the used equipment market. They then prepare that equipment - including the potential installation of telematics - and move it to where they believe the equipment will generate the best potential returns in the rental market. Key Accounts spend $250,000/year with URI and represent 72% of URI’s customer base. After the equipment has gone through multiple maintenance cycles and has been rented out for much of its useful life (~7-9 years), any equipment that is still in good condition is then sold to different parties (often including current customers). URI also utilizes Auction, Broker, and OEM repurchase offers to generate cash from used equipment assets.
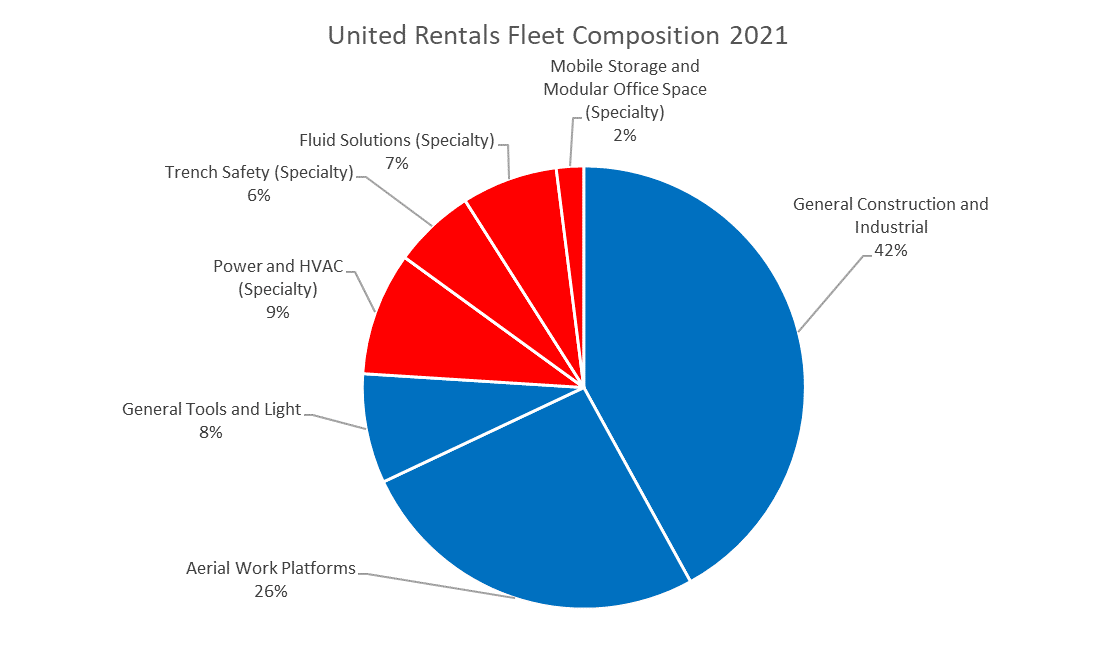
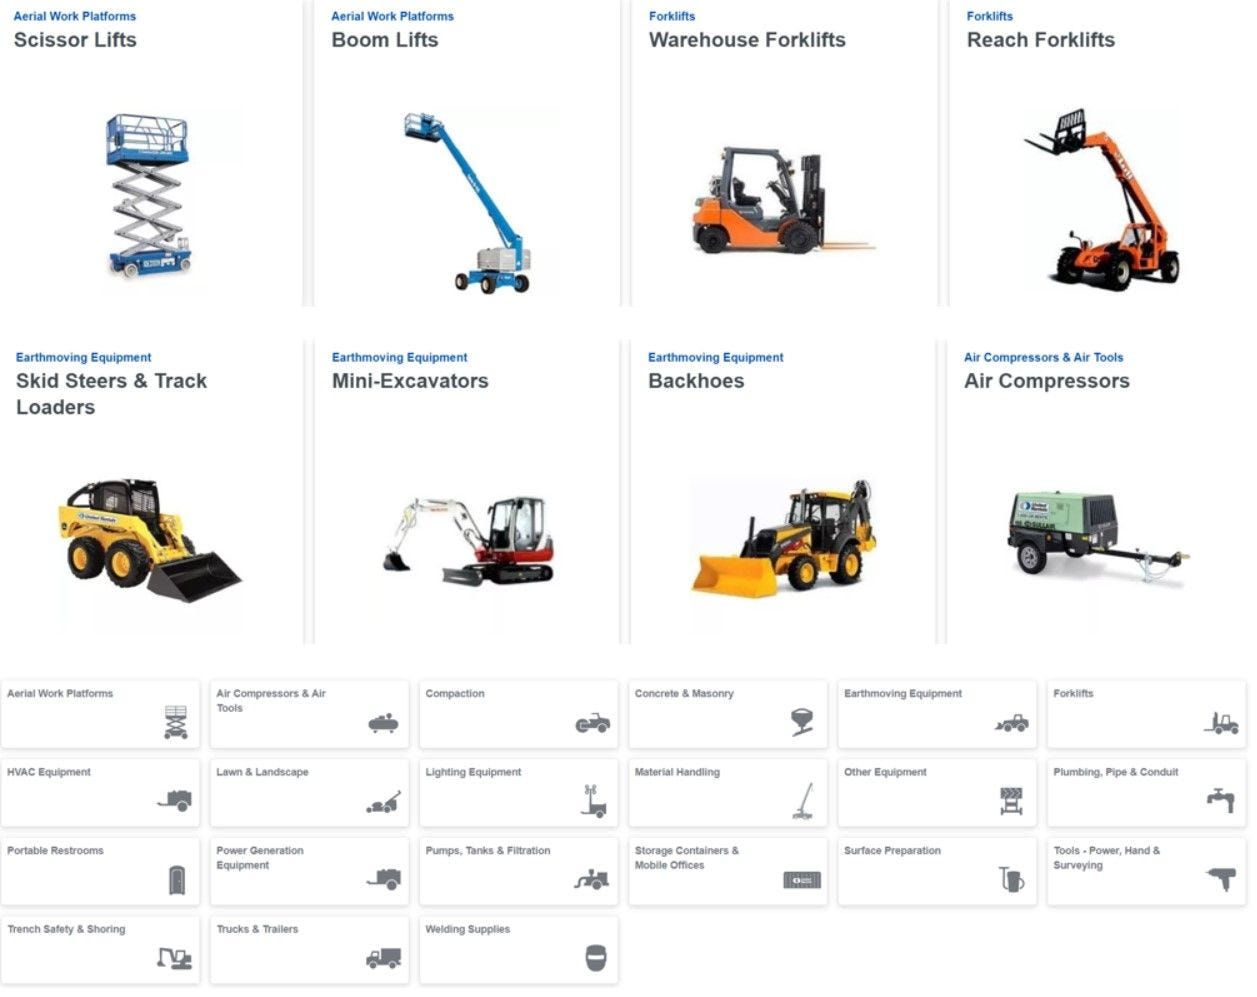
United Rentals Fleet portfolio by category is outlined below in Exhibit C, with Specialty Rentals assets highlighted in red. In 2022, the most popular equipment rented out from the company included Scissor Lifts, Boom Lifts, Warehouse Forklifts, Reach Forklifts, Skid Steers/Track Loaders, Mini-Excavators, Backhoes, and Air Compressors. Exhibit D includes select images of its equipment portfolio.
History
United Rentals was founded in 1997 by Brad Jacobs, and likely many successful entrepreneurs had a relatively unconventional background. He was initially studying math, classical music, and jazz at Bennington College and Brown University but eventually dropped out. His interest in making money eventually led him to cold calling his way into the oil trading industry. A few years later he co-founded Amerex Oil associates where he served as CEO until the business was sold in 1983. He then founded another oil trading firm Hamilton Resources, eventually growing this entity to $1b in revenues.
His first foray into a different industry was when he founded United Waste Systems. As Chairman and CEO, he pursued a strategy of consolidating small garbage collectors in rural areas (where competition was more limited) and then eventually IPO’d the business in 1992. By 1997 he had built the business with more than 200 acquisitions and integrated operations across 40 landfills, 86 collection companies, and 79 transfer/recycling stations across 25 States. The stock delivered a 55% CAGR from IPO until it was eventually sold for $2.5b to the entity now known as Waste Management Inc. United Waste Systems during its public life outperformed the S&P500 by 5.6x.
Brad Jacobs had collectively created 5 publicly traded companies each having performance >1,000% returns from the time of his leadership. What may not be evident from the above is that he has generally relied on similar investment criteria during each of these different iterations. He simply looked for large fragmented industries growing faster than GDP, and areas where scale & technology can drive attractive returns – so far this simple framework has been quite successful.
United Rentals early in its history was very focused on small acquisitions as the company built up its scale. Their were plenty of cost synergies URI could wring out of these small businesses including SG&A savings and the benefits of lower equipment costs by leveraging the purchasing power of the larger entity. Up until 2008, the portfolio of acquired businesses were relatively independent and had limited technology best practices embedded across the organization. In 2007-2008, the company was hit with multiple issues including an SEC inquiry, faster-than-expected deceleration in end markets, and integration issues from prior acquisitions. This eventually led to a sale process, and in April 2007 URI reached an agreement to be sold to Cerberus Capital – but later that fall Cerebrus pulled out of the deal as the GFC sent construction markets and credit markets into a severe downturn.
With the sale falling through, Mike Kneeland took over leadership in 2008 with no shortage of issues to address. The primary challenges were related to weak rental market rates and the high levels of debt it needed to finance/re-finance over time. To address short-term issues, he sold off parts of the rental fleet into used markets, cut capex, and completed layoffs to better match their supply capabilities with a very weak demand environment. One of the bigger strategic initiatives he drove was focusing more on National Accounts which required better equipment sharing across the organization but also had more stable revenues due to size/breadth. To meet these customers' needs the company had to build a culture that encouraged the growth of corporate profits even if an individual branch saw profit pressures. Incentives for managers were previously focused on EBITDA which encouraged empire-like building but he improved metrics to include EVA analysis. With the EVA framework all assets at the branch level now had a minimum required rate of return that needed to be generated before bonuses were paid. Furthermore, branch manager and district manager compensation were all shifted toward regional entities which tied those employee’s financial rewards to broader performance/collaboration.
Under Kneeland, COO Matthew Flannery also drove substantial operational improvements. This included pricing improvements, administration efficiencies, and logistics. Newer systems to drive effective pricing pulled this responsibility away from managers and towards an internal team which built up a view based on statistics across the nation. For customers who had previously bid for equipment at multiple branches, this more standardized pricing resulted in far fewer instances where branch managers accidentally underpriced their equipment. Large investments were also made into technology which improved order-taking, logging, and filing processes for both employees and customers. Mobile capabilities were also put into the hands of employees which put them in a stronger position relative to competitors.
After the internal operations were running smoother, the company looked to consolidate in the industry, eventually acquiring half of the largest top 10 competitors in the USA. Since inception the company has since gone on to complete >300 transactions which collectively added expertise in new product segments, new business platforms, or allowed them to obtain equipment when supply chains were constrained. We believe capital has been deployed effectively estimating that acquisitions have generally been completed at low-teens IRRs prior to revenue and cost synergies and in the high teens IRR range after synergies. Former executives in the industry we have spoken to have suggested URI is well positioned to continue with this strategy by leveraging their experience and scale.
The next phase at the company was of rolling out Kaizen processes across the organization. This started with about 8 events at select locations but grew rapidly into all regions as the response and results were very positive. The initial areas of improvement were how logistics were executed and targeted the most common issues that occurred for clients. URI formalized these initial lessons into forms which were then rolled out to the entire branch network. URI held hundreds of Kaizen events in 2014 and 2015, which eventually led to >100 formal operational excellence positions being added through the different regions.
In the latest 7-year period, the company continued to build up its general tools rental business and grow its specialty business which added higher ROIC & lower volatility profit streams. In 2014, the company launched United Academy, an online training platform for safety training and operator certification. By 2019, United Academy had >400 in-person or online courses. We believe this helps satisfy both national accounts and small customer needs while also reinforcing the URI brand. Additionally, the company has continued to digitize its capabilities during this period to more efficiently serve the customer base and drive internal cost improvements.
Rental Market Overview
Competing in a growing market
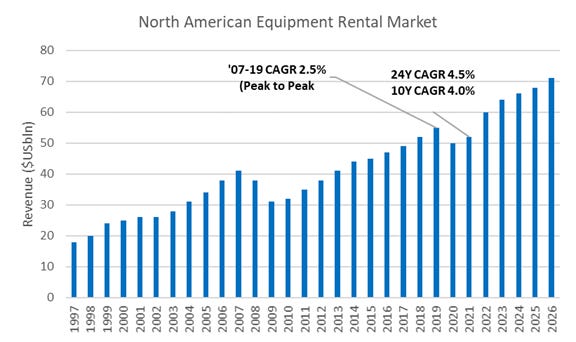
The U.S. General Rental, Construction, and Industrial equipment markets have grown at a 4.9% CAGR from 1997 to 2021 as shown in Exhibit E. ARA / IHS Global is forecasting a ~6% CAGR from 2021 to 2026 for the North American equipment rental market. If we look at peak industry revenues from 2007 to 2019 the market grew at a 3.3% CAGR. Over time the Top 10 U.S. rental companies have increasingly represented a higher proportion of total industry revenues. In 2010 they represented just 20% of revenues but by 2021 they represented 40% of revenues. URI has played a disproportionate role in consolidation activities over the past 10 years, and in general, larger competitors have also gained market share during this period.
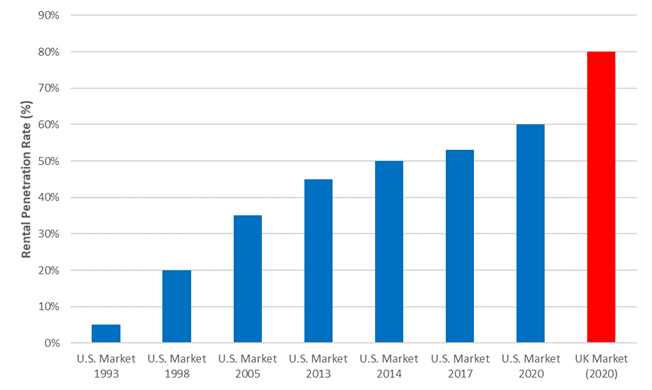
Customers can choose to own or rent equipment. Rentals made up just ~20% of consumption in 1998, but a preference to rent vs own has increased dramatically with rental penetration now at ~60% in U.S. This has been driven by a growing focus on core operations, minimization of capital intensity, improved availability of rental equipment, reduced downtime associated with rented equipment and lower expenses as maintenance, pick-up/delivery and storage are all effectively outsourced. Exhibit F illustrates the longer term penetration trends in the US and compares the industry position to the UK which has effectively matured at 80% rentals.
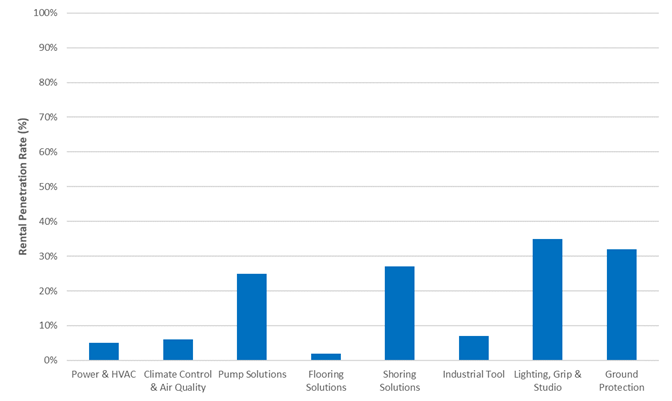
The statistics above show the progress made across the industry with the rental model but we believe this still understates the longer-term potential of the business as there remain newer areas in the rental portfolios such as floor scrubbers which still have just low single-digit penetration today Ashtead, the #2 player in the US has highlighted in the past how the facility maintenance, repair, and operations market has an estimated size of $7-10b but only has minimal rental penetration today suggesting years of growth for this group over time. In Exhibit G, we show estimated penetration rates which highlight future sources of industry wide growth. In the near-to-medium term, cost inflation for new equipment, operating/technical changes, and Health, Safety and Environmental (HSE) related concerns are all likely to support the rental value proposition. For smaller operators, effectively maintaining owned equipment is technically challenging and rarely within their circle of competence. That’s where URI steps in with a focus on life cycle maintenance and dedicated employees to ensure that when customers not only get the equipment they need, but that the equipment runs reliably at high capacity. There remains significant room to grow USA/North American rental penetration to the 75-85% range seen in other markets around the world. Rental penetration may also receive an ESG-related penetration uplift at some point as more companies seek to offload their environmental footprint for reporting purposes.
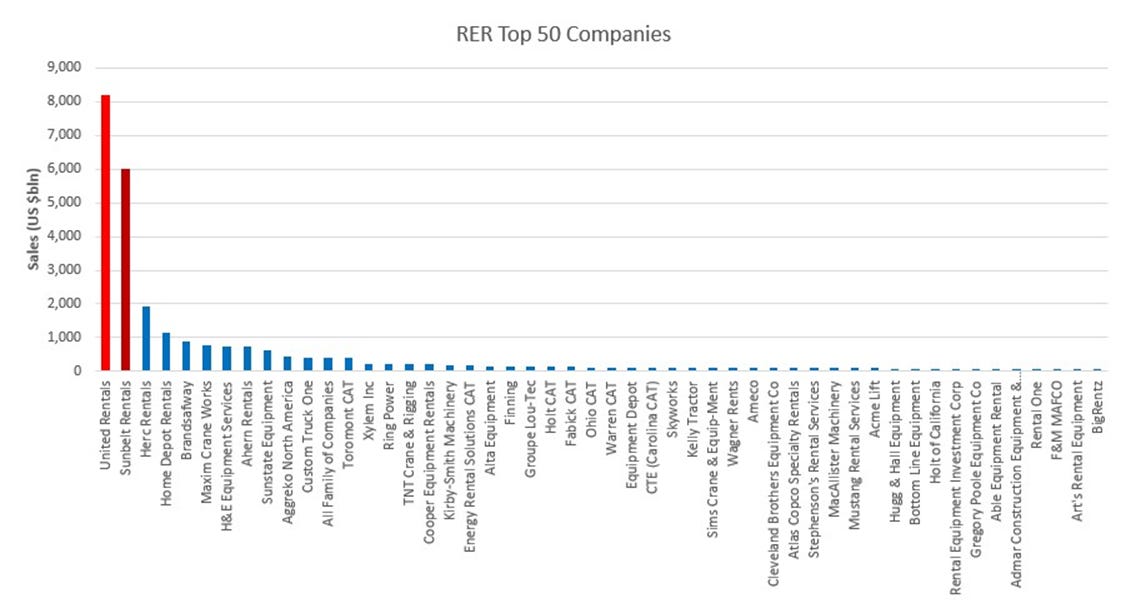
URI is the largest equipment rental company in the United States, selling 37% more than the number two player Ashtead and greater than the number three to fourteen players combined. Rental Equipment Register, publishes annually an overview of the largest 100 equipment rental companies in North America. As shown below, URI and Ashtead (Sunbelt) dominate this space and the top 5 companies have nearly 40% market share with the rest largely made up of smaller medium size local or regional rental companies. URI has obvious scale advantages compared to most of these competitors while its larger footprint also allows them to drive higher utilization on its equipment fleet through sharing amongst different branches. Exhibit H provides an overview of sales for the top 50 equipment rental companies in the U.S.
Specialty Rentals
Specialty Rentals is an attractive and rapidly growing part of the market. While this part of the market is not universally defined by the industry it largely includes areas with lower penetration and is often sought after by customers looking for a solution rather than having pre-determined requirements. Customers will often come to URI with a specific problem like excess water on a construction site. A URI customer agent will then send over water engineers & specialist teams to suggest a solution and provide a cost estimate. The customer is typically quoted a fixed price which would cover both personnel & tool usage – this results in superior margins compared to the general rentals business as shown in Exhibit I. In these situations, the customer is prioritizing the problem getting resolved efficiently and quickly rather than achieving the lowest cost. The more specialized nature of this business, including the need for highly trained personnel, has allowed the industry to generate more robust margins and returns than in the general tools rental business as shown in Exhibit I.
Structurally improved Industry
A primary concern of some investors is that the leading rental companies could deliver peak-to-trough operating income performance similar to what had occurred during the past cycle (-76% for URI & -71% for AHT). But there remain many reasons why this shouldn’t be the case. To start, end customers in the last cycle generally had a greater bias towards owning their equipment and maintaining it themselves –only when they needed incremental equipment would they lean on rentals to “top up”. Over time customers have grown to appreciate the benefits of rentals (hence higher rental penetration), and the logistics services for rental companies have also improved to better match customer needs. Now for customers who are currently renting all or most of their equipment, the chance that they decide to go ahead with a large capital outlay amidst an uncertain environment seems very unlikely – we would almost expect that rental penetration could increase in the next downturn, offsetting some of the decline in end customer activity levels.
Market share for the top two companies has also grown to represent >25% of the industry as shown above in Exhibit J so pricing discipline should have improved vs the 2008 to 2010 period when there was a short period of very aggressive/uneconomic pricing occurring to minimize cash burn. This was likely exacerbated by the higher levels of financial leverage that was also utilized throughout the industry – Both United Rentals & Ashtead had ND/EBITDA >3x during this period. Last but not least, we believe there have been significant improvements overall to how companies manage their fleet – incentives are better structured to drive equipment to areas where it will be utilized. Pricing should have improved as entire fleets are now being tracked digitally and algorithms are now guiding decision-making. Improved operational efficiency, continuous improvement programs, and the adoption of technology like telematics have supported companies like URI seeing margins move up 1,300-1,900 bps vs 2008-2009. Longer term we have seen lower debt utilization by the industry and gradually improving ROICs as shown in Exhibit K. All said, the industry is much better structured than it was 10+ years ago, and in our view much more ingrained into the operations of many customers’ workflows.
Illustrative Unit Economics
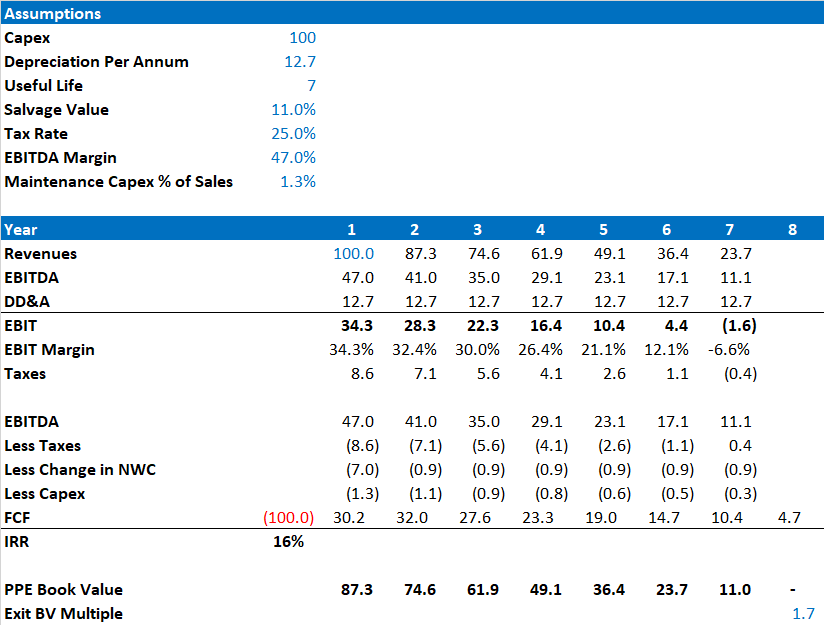
Below in Exhibit L we provide an illustrative overview of the companies per unit economics assuming $100 capex investment and straight line depreciation over a 7-year life. This implies depreciation of $12.70/year and then at the beginning of the 8th year we assume they dispose of the asset at 1.7x book cost. Then in the process of renting out the asset we assume ~47% EBITDA margins after accounting for key operating costs. We assume a nominal 1.3% of revenues dedicated towards spare parts costs and a 7% net working capital assumption. In the forecast period, we assume revenues generated from the asset decline alongside book cost – matching the historical relationship on a corporate basis. This results in an IRR of ~16% which we believe is attractive and highlights the organic reinvestment opportunities the company has.
Suppliers Unlikely Threat
One commonly perceived risk is the idea that suppliers could circumvent URI and start their own rental business. In our view, it’s not that simple. For starters, URI is one of the biggest purchasers of equipment for most OEMs and URIs largest supplier represents only 9% of capex which has steadily declined from 25% in 2009 as shown in Exhibit M. For that OEM to go into direct competition with one of their biggest customers for an uncertain return seems like a risky proposition. It’s also important to recognize that many customers will need more than one type of equipment on a job site, and not all OEMs can offer everything, which means that either the customer has to deal with another partner (adds friction for end customers) or the OEM has to acquire equipment from a direct competitor (seems unlikely). The OEMs also don’t have expertise in maintaining, moving, procuring, or training customers to properly utilize equipment.
In Exhibit M, we show two of Caterpillar's largest dealers Finning (FTT) and Toromont (TIH), which both have small rental operations and whose portfolios skew towards construction, and earthmoving equipment (CAT products). On a combined basis, these two companies have grown revenues at only a 2% CAGR in the prior decade, a rate which is well below what has been achieved by the industry at large. TIH has increasingly focused on equipment rentals and over the prior decade it has had some success growing its operations. Despite this recent momentum, we expect lower ROI over a full cycle due to disadvantaged purchasing scale, reduced cross selling potential and limited regional diversification. Both of these dealers are effectively land locked given the exclusive agreements they have with Caterpillar – this limits long term reinvestment potential, and the ability to move equipment to higher demand regions. United Rentals scale advantages are clear when we compare TIH location count of 70 to their 137 in Canada.
Competitive Position
Advantage #1: A wider selection of general tools and specialty equipment driven by asset sharing
URI can offer customers a wider selection of general and specialty tools than most competitors and offers an estimated 4,300 classes of rental equipment to its customer base. Having the right equipment available for customers has always been an important component of the customer value proposition. As URI has continued to grow investments into different specialty tools and onsite services this has allowed them to increasingly become a single source provider for many different job sites.
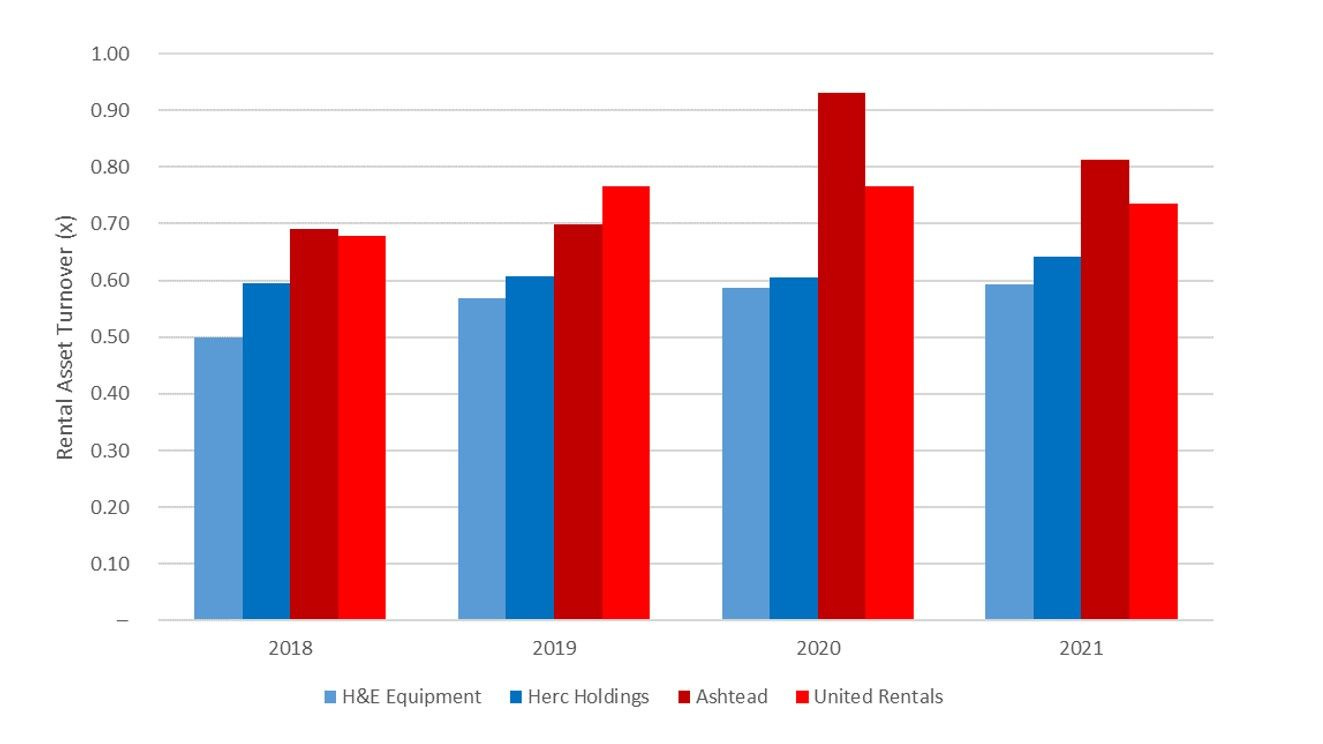
It is important to note that URI’s overall fleet is managed on a company-wide basis. This means that it is much easier for customers to find the right piece of equipment even if it is not currently nearby and results in superior rental asset turnover as shown below in Exhibit N. If customer needs are more complex and require a combination of heavy, light, and specialty tools they are much more likely to find all their tools with URI. Having one provider for these tools instead of multiple providers greatly simplifies the customer operations. Alternatively, if the customer were to select 3-5 different equipment providers to obtain equipment for a construction site this would need to be scheduled and managed, effectively drawing resources away from the core competencies of most contractor businesses.
Underpinning the portfolio of assets is logistics capabilities that make this sharing possible. URI has a fleet of ~12,900 vehicles which are used for delivery, maintenance, management, and sales functions. Providing customers with an option for delivery or pick up can allow them to optimize costs on their end and outsource needs to URI if required. Having access to the full fleet instead of just what is available at a specific store improves availability metrics for customers and for URI it improves turnover and capital efficiency.
“In the past, we served the customers with the resources and the fleet of a single location. But today, our metro customers have access to the entire network of local stores. And since we've introduced the metro concept, our fleet transfers, a measure of capital efficiency, have increased substantially, in fact, have increased by 30% since 2016. Free-flowing fleet between locations means an improved customer experience, better margins and returns and ultimately, less capital expenditure.” Michael Durand 2018 Investor Day
Advantage #2: Purchasing Power
URI also benefits from scale in that they have considerable purchasing power and is known to obtain better pricing relative to smaller regional or local competitors. Throughout the 2010s, the company acquired several large rental businesses including RSC, NES, and NEF, where it was revealed they had a ~2-8% supplier pricing advantage over these entities. By obtaining better pricing, the company can generate better returns on investment than peers who may charge similar rates for renting equipment. In terms of the sheer magnitude, URI bought ~50% more equipment last year compared to Ashtead and 5x more than Herc, the two largest peers. Management has discussed in the past that as the company’s purchasing volumes go up they are often able to achieve greater discounts – IE) The first 100 units could be $100, the next 100 units would be $95 and the next $100 could be $90.
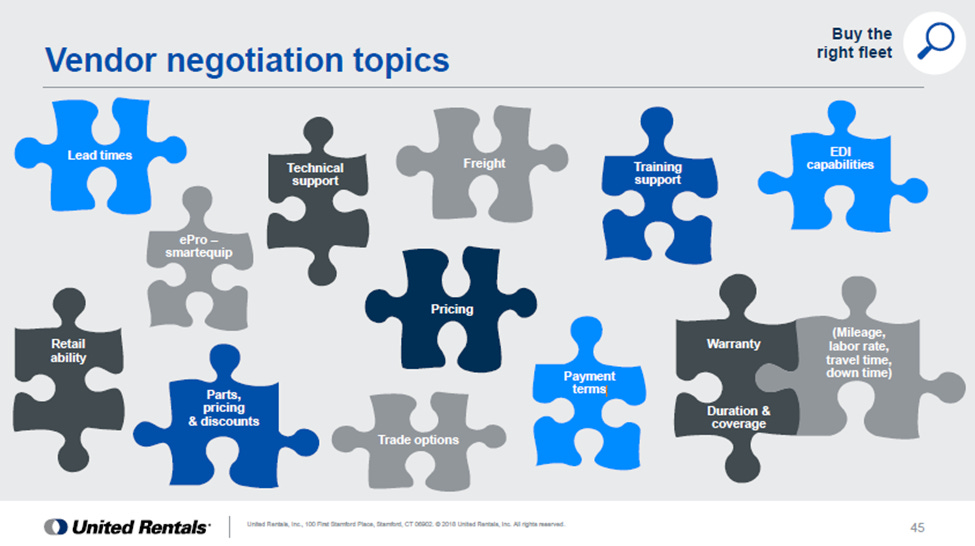
URI focuses on the total cost of ownership of each asset when going through negotiations with its suppliers and emphasizes equipment availability, warranty coverage, training, parts, freight costs, and technical support quality when assessing each vendor. For warranty, they specifically evaluate the duration, potential reimbursement rates when issues arise under a warranty period, and what is covered under the agreement. Select vendors also provide additional training so that the company can ensure equipment is well maintained over its useful life and utilized effectively by customers. Parts need to be replaced during the life of a rental asset, and availability/pricing of these parts can be provided on preferential terms relative to smaller peers. Purchasing power ultimately drives down the company’s capital costs, and operating costs and supports higher equipment availability for customers (better service). Exhibit O provides an overview of all of the different areas they negotiate with suppliers.
Advantage #3 National footprint allows them to serve large customer needs
URI’s geographic footprint allows them to meet the needs of large customers better than regional competitors, and the importance of large customers is evident when we consider that >72% of URI revenue comes from customers who spend more than $250,000 per year and often rent equipment from multiple locations. To serve these customers, the company simplifies the procurement process establishing a single point of contact for them and thus creating a more consistent level of service regardless of where the equipment is being used. Large customers may often get better pricing than smaller customers, but URI believes this is more than offset by the consistency of rental frequency and longevity associated with larger projects.
For any customer, one of the primary goals of delivering a project is to ensure that it is completed on budget and schedule. Through the procurement of required equipment from a highly reliable supplier like URI, they can eliminate a source of risk that could create a waterfall of other issues. Even if a piece of equipment has a failure, a replacement machine can often be more quickly obtained given the size of URI’s fleet. Additionally, when telematics is installed, URI gets immediately notified when there is an issue.
United Rental’s UR Control platform also provides a clear snapshot of equipment available for rent, an ability to extend or end rentals, and a way to set up automated custom reports. For project managers or financial analysis purposes, this can allow customers to see which tools are being used most efficiently and where potential resources are being wasted. For large enterprises, these tools greatly simplify the overall financial analysis and management of spending levels.
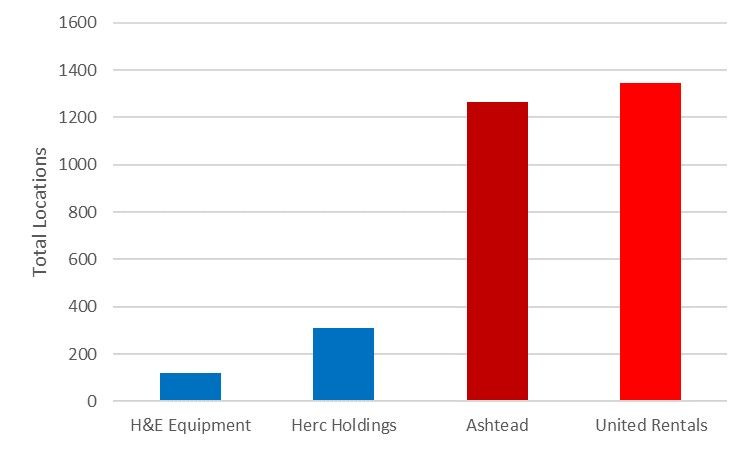
An additional reason why the national footprint is relevant for certain types of contractors is that depending on the state in the US, there are often reciprocal agreements in nearby states allowing contractors to work in multiple regions. As contractors grow in scale, these agreements create natural areas for the company to grow into over time. URI provides a seamless ability to continue growing into new states and little to no retraining is required as the UR Control platform is standardized regardless of where the equipment is utilized. Exhibit P highlights the location count advantage the company has over its peers – this results in URI having better coverage across multiple geographies to serve rental equipment demand.
Advantage #4 Better unit economics due to better leverage on centralized costs
The rental industry is reasonably fragmented, with the top 10 companies representing 40% of revenues for the industry, and thousands of small competitors filling out the long tail. Each of these small competitors have duplicative administrative functions which are not efficient and all else equal - this should result in lower corporate margins.
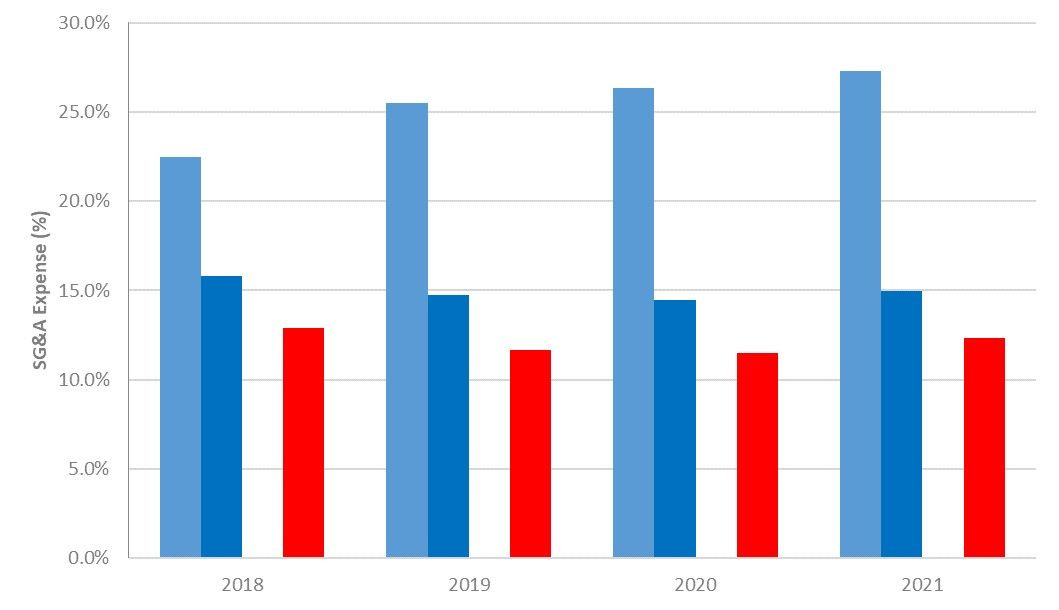
In our view, the average small competitor is much less sophisticated than industry leaders. Areas like credit can be better managed and equipped with stronger internal/external tools and processes while smaller entities are more likely to run into adverse selection issues. Additionally, areas like Information Technology can be scaled across a larger organization to drive better information flow, and overall productivity. Exhibit Q shows a comparison of small public rental companies vs URI, and illustrates the superior leverage URI can generate on SG&A.
Advantage #5 Unparalleled data, analytics, and technology capabilities
URI is well known for having the leading technology platform in the industry, which provides customers with 24/7 access to URI’s products, tools, information, and services. The website “UR One” is a modern, clean, and consistent interface for the entire customer base which allows them to rent, buy, manage orders, equipment purchases, and complete training. Additionally, on the website, they have built out a rich library of content and expert guides to ensure customers are selecting the right tools for the job. URI offers its “United Academy” to ensure that customers are well trained on the equipment they will be using and is aimed at reducing incidents on worksites.
We believe the company’s investments in this area are one of the biggest differentiators compared to smaller peers. Through these investments, the company is better able to implement Kaizen processes that utilize data and adjust practices to eliminate waste. URI has also automated more administrative processes which frees up further resources and allows the company to dedicate its workforce to satisfying customer needs & driving long-term loyalty. Previously, the management team has highlighted how they built fit-for-purpose mobile applications for specific tasks like Pickup, Inspection & Repair, Route Optimization, and Staging – each of which we believe aids in an efficient operation.
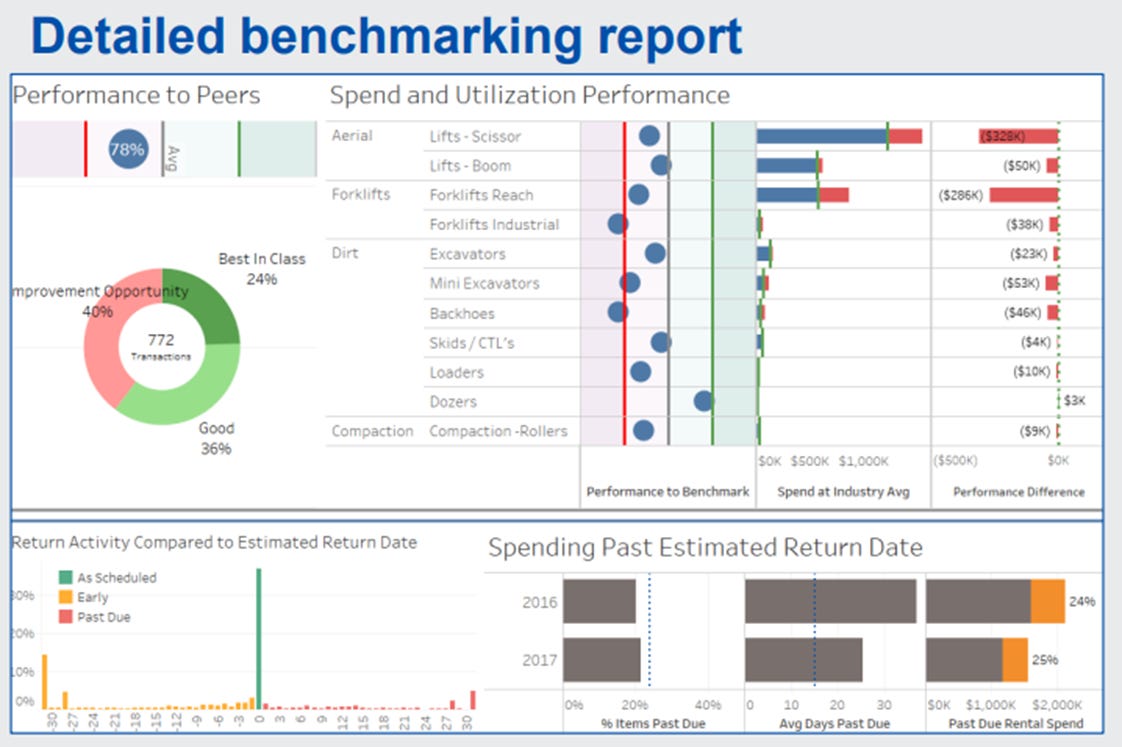
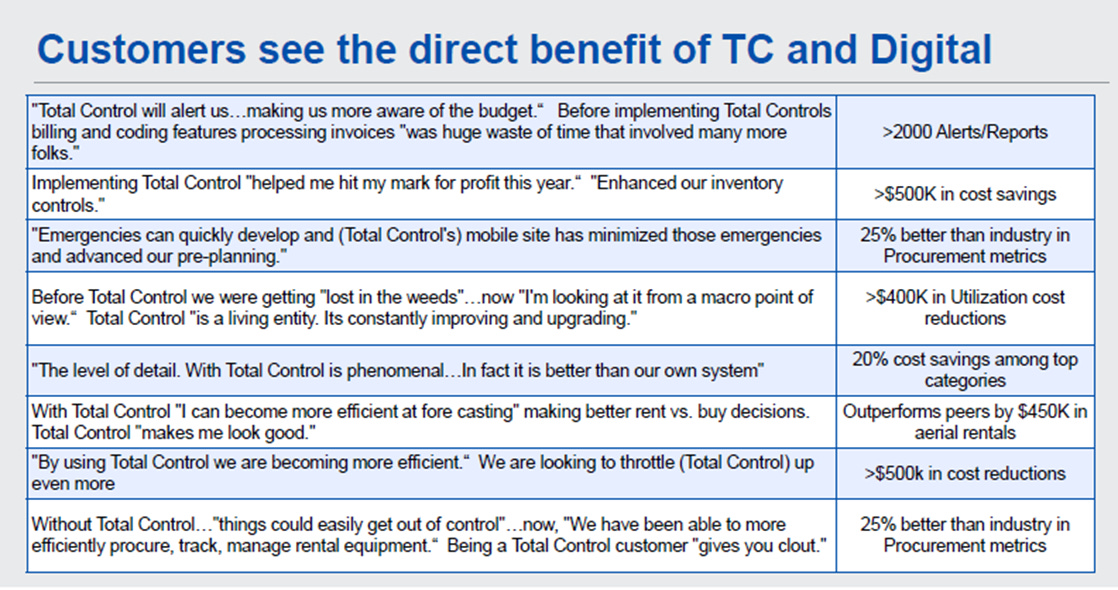
For customers who use a combination of owned assets and rental equipment, URI offers Total Control ® which lets them locate & track utilization levels, maintenance, obtain invoices and complete bill payments. Potentially most importantly for larger contractors they can create custom reports and track KPIs which allow the company to better estimate whether projects are tracking on budget. URI’s internal data can also provide benchmarking reports (shown below in Exhibit R) to highlight how performance compares to the industry and dedicated employees then provide recommendations on how improvements can be made to customer processes. If spending exceeds or is approaching targeted levels customers can be notified through alerts or customized electronic reporting. Customers have consistently reported a wide range of benefits from utilizing the platform with cost savings being one of the most frequently cited areas as shown in Exhibit S. Collectively, technology investments drive efficiencies in URI’s operations but also for customers which we believe improves the overall customer experience.
“And standard process is really good. But it's even better when paired with the right technology. In a large distributed organization like United Rentals, it's imperative that we enable our local teams with the right technology in the right places. And we've deployed each tool based on field feedback. We've created, tested and scaled new tools in very specific places throughout the supply chain and order process. These enhancements reduce keystrokes, reduce footprints and support consistent and standard work. And they also enable us to scale across the organization our true competitive advantage. Alongside our standard processes, the right technology allows us to rapidly improve the efficiency of our existing location and also aids in integrating new acquisitions. The benefits are clear. Locally, our teams are able to operate more efficiently with standard processes enabled by technology. And across the enterprise, we're able to use data to identify opportunity for innovation. “– Michael Durand 2018 Investor Day
Advantage #6: Geographic and customer diversity leaves them with limited exposure to any customer or region
United Rentals has ~1,255 locations in the USA and another 196 locations spread across Canada, Asia Pacific, and Europe (~1,450 in total). Despite a much higher skew towards large national accounts, they still have low customer concentration with the largest customer representing just 1% of revenues over the last 5 years. Even when we consider the top 5 customers, that mix has shifted from 6% to 4% of revenue over the past 5 years. These metrics suggest low individual customer concentration but underlying correlations are likely higher than this data suggests. Customer activity levels will be driven by the economic environment, interest rates, and overall equipment availability.
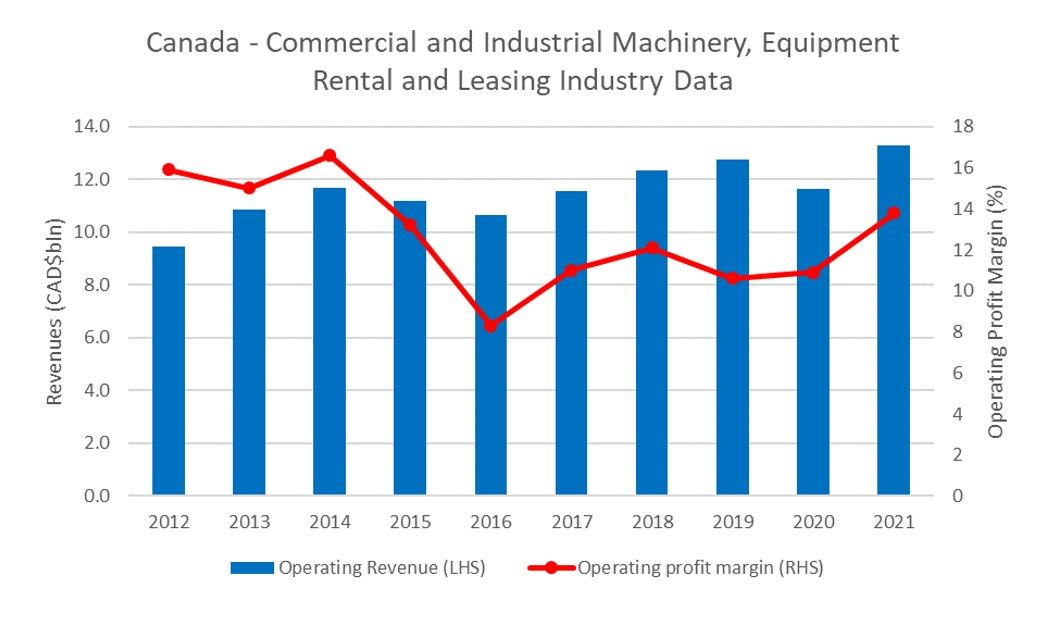
The best example of how URI could better manage through a cycle would be to look at Canadian Industry Data, show in Exhibit T. The Canadian rentals industry had peak margins in 2014 then went through a 2-year downturn where industry margins fell by 830 bps. During this period, URI used its relocation and repurposing expertise to move equipment out of Canada and into stronger markets while demand was depressed. This highlights another dynamic where subscale regional peers would not have this option and may have been forced to sell assets into a weaker demand environment to generate cash flow.
Back in 2015, former CEO Kneeland explained, " While we expect to see a drag in some trade areas from the slowdown in upstream oil, our exposure is greatly limited by our size, agility and diversification. Furthermore, we believe that low oil prices will be a boon to many sectors we serve, spurring demand in manufacturing and other markets hungry for our fleet."
Advantage #7 M&A Competency
United Rentals is widely known in the sector as one of the few companies in the space with the experience and capability to complete large acquisitions. Sunbelt, the company’s largest competitor has also reiterated to investors many times in the past that they prefer to build out the asset base organically leaving even fewer bidders at the table for many deals URI is interested in. Herc, another growing competitor (but still much smaller) has limited integration experience, and are likely to only to consider M&A as an option to grow in special circumstances. It is important to remember that URI was effectively built through ~300 transactions. While not every deal was a success, this high-frequency iterative process has given them plenty of experience to improve their M&A prowess. The current CFO has been the first to admit that URI has made every mistake in the book, but through these mistakes and iterations, they have built the most robust M&A playbook in the industry. This means even in complicated or “hairy” situations the company can make a bid for incremental assets and generate attractive returns. Much of the industry utilizes software “RentalMan” which is an ERP offering from Wynne Systems, which makes integrations much more seamless. URI has also made incremental investments into software customizations on top of this system to aide and improve its overall processes.
If we look at the major transactions completed since 2012, the company has typically categorized deals into two groups (1) Core Rentals and (2) Specialty as shown in Exhibit U. Most of the large deals completed since 2011 have been funded with cash, and in my opinion, only one was a disappointing deal when I look back at the track record. That deal was National Pump, which was acquired near the peak spending environment in the oil and gas sector. The subsequent decline in oil and gas activity led to disappointing post-acquisition performance relative to initial expectations. Outside of that deal, I believe most have achieved returns in-line with management and investor expectations. This has been driven by two factors (1) the company’s ability to deliver cost synergies like a reduction in redundant costs at the acquired entity (SG&A etc.) and obtaining better discounts on purchased equipment, and (2) effectively cross-selling incremental services. We estimated that through cost + revenue synergies they have generally been able to improve EBITDA performance by 25-30% on deals in the past.
Management & Governance
Observation #1: Strong Leadership & Deep Bench
CEO & President, Matthew Flannery is the 4th CEO the company has had since its IPO. He joined URI in 1998 when it acquired McClinch Equipment and has since held multiple executive roles. Annualized returns during his tenure look better than any of his predecessors. We believe he has continued to drive consistent execution and profitable reinvestment into specialty assets. Recent investment shifts have included incrementally buying a higher share of electric-fueled equipment and consolidation of Ahern Rentals - both of which should help better position the company long term.
There is a very deep bench of potential successors below Matthew who could all take on incremental responsibility over time. This includes Dale Asplund who is the current COO. The COO role was held by each of the previous 2 CEOs, suggesting he could be one of the future successors. Within the C-Suite the only notable change has been a change in the CFO position where Ted Grace, (Former VP of Investor Relations) has taken on the role in 2022 after the prior CFO had left for a similar role with US Steel. From the outside, that move appears to be a downgrade on the size and business quality front, so we would imagine other factors may have been at play in her decision-making. Ultimately, we continue to believe the company has strong leadership in place and we see limited succession concerns longer term.
What I don’t like is how little inside ownership there is. Collectively, there is about $100m in ownership by the board and executives. Which is quite low given the top 5 executives compensation was in excess of $27m last year. Insiders have also been net sellers over the past 12 months while aggregate exposure has been largely maintained as additional granted shares have provided some offset. Looking specifically at KPIs for the annual bonus program we believe it is reasonable focused on Adjusted EBITDA and the Economic Profit Indicator (EPI) captures the spread between the ROIC and assumed WACC – importantly, when they calculate this measure they use a conservative 10% which is well below the 8.7% WACC Bloomberg has reported over the past decade. Longer term incentive plan focuses on revenue growth and ROIC calculation which is relatively clean. Rounding it all out, we see more positives than negatives and would like to see management ownership at higher levels.
Observation #2 Better-Than-Average Culture & Employee Focus
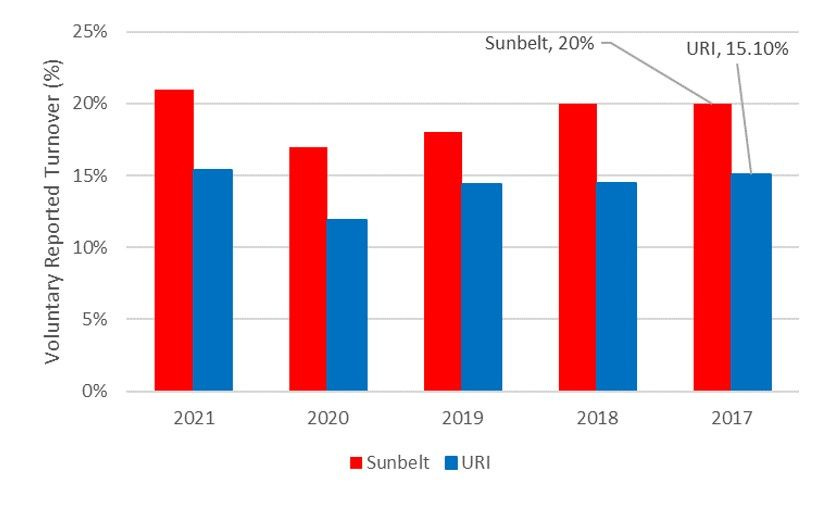
As it stands, URI is heavily reliant on its team to deliver a positive customer experience, and as a result, employee satisfaction is critical over time. Management believes they have been able to achieve this through consistent promotions within the company and by providing an attractive environment for employees to grow. And the proof is in the pudding, with employee turnover rates below levels reported by competitors like Sunbelt Rentals over the past few years as shown below in Exhibit V.
URI, like many corporates, has also implemented an Employee Stock Ownership Plan (ESOP), which we believe helps drive an ownership mindset throughout different layers in the organization. The program appears quite attractive, and when combined with the 401K, employees could be earning up to 25% of their base salary/year through these additional incentives. Also, as we compare Glassdoor ratings vs peers like Sunbelt and HERC Rentals they appear to have modestly better recommendation & approval ratings. Last year the company was also selected as one of the Forbes Best Employers for 2022 and the Top Workplaces USA Award by Energage. In short, I believe they’ve reinvested adequately into their employee base and in building their corporate culture.
Valuation
General Rentals, Specialty, and OEC Growth
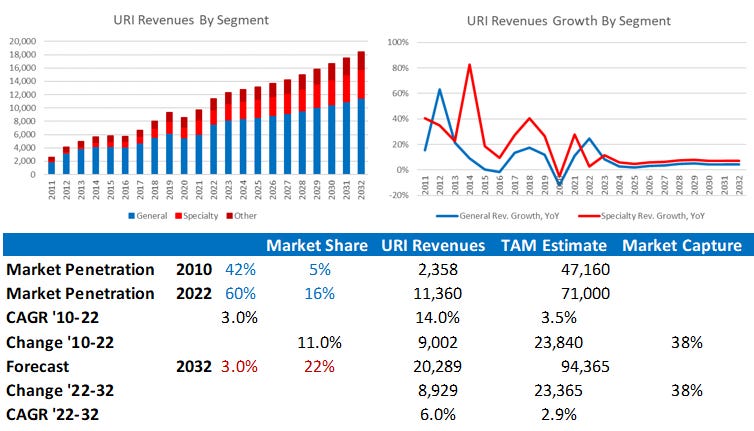
The primary driver the of General Rentals and Specialty segment is the average Original Equipment Cost. As URI wants to generate more sales over time, they need to have the relevant equipment and locations near the customer base so it can economically serve this demand. We still see the potential for rental equipment penetration to increase over time and the location count is expected to grow alongside a growing fleet. Historically, the company’s fleet has grown meaningfully when an opportunity has come up to acquire a peer – but with Ahern Rentals now acquired there are limited larger peers they could acquire, incremental growth is likely to be organic. Exhibit W shows the average fleet size over our forecast period along with company’s location growth over the past 10 years and revenues per location which are expected to reach a record high in 2022.
My 2031 forecast shows aggregate revenues growing to 20.3b, and specialty growing faster than the general rentals business ending the forecast period at 33% of total sales. It is important to note that incremental growth is still expected all segments due to expected market growth and increasing penetration. We expect an 9.7% CAGR for Specialty and General Rentals Revenues to grow at 6.6% CAGR. If we assume 3% market growth over the next decade, this implies a TAM of 94.4b in 2032 – If URI continues to capture similar levels of industry wide growth as it did the past decade (38%) then it appears we should expect them to have near 22% market share. This market share estimate largely matches competitor expectations for the top 3 players and the top 50% of the market to be represented by 2-3 players.
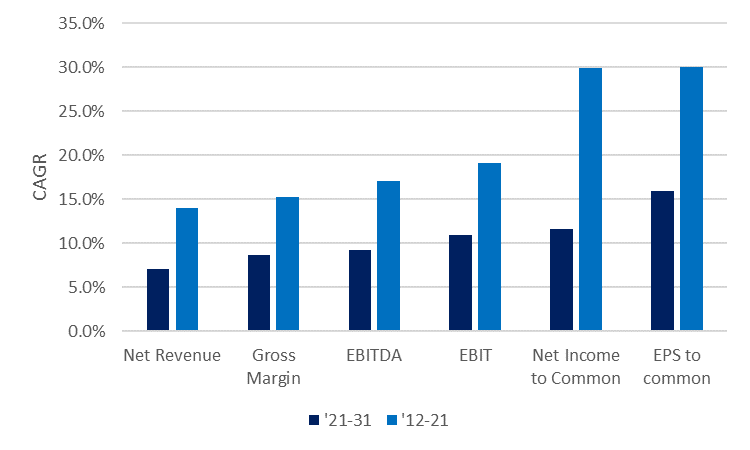
As shown in Exhibit Y, Gross margins are expected to reach a record high through a combination of more disciplined industry pricing and increasing share of specialty. However, temporarily we expect them to have peaked in 2023 then be under cyclical pressure for 2 years. In the base case, we have gross profits roughly doubling by 2029 and growing at a 9.2% CAGR from 2021 to 2031. We expect a modest 50 bps improvement to SG&A costs over the forecast period through continuous improvement initiatives. We see incremental declines potentially harder to achieve without some wide scale process automation or other factors beyond our knowledge but acknowledge we could be surprised here.
This collectively leads to GAAP Net Income CAGR of 11.6% during our forecast period, with EPS growth expected at a 16% CAGR driven by buybacks where we deploy excess cash flow in our base case.
Sources and Uses of Cash
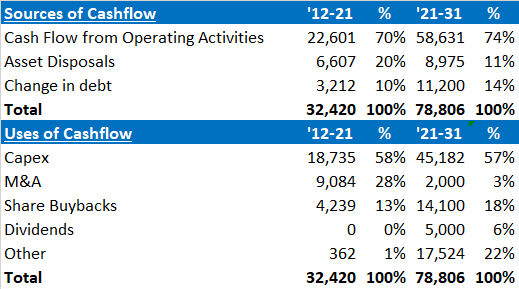
As I already highlighted, URI should generate substantially more cash flow than they can spend organically and while we see the limited potential to complete larger acquisitions, small tuck-ins should continue to represent an attractive reinvestment opportunity as these locations/equipment/expertise are rolled into URI network. We don’t model in incremental M&A, instead, we have the company returning capital to shareholders via buybacks and dividends which we expect to be initiated in about 5 years as shown in Exhibit Z. Through buybacks shares outstanding are expected to fall by ~34% over the next decade on our forecasts.
Base Case Vs Historical Results
Exhibit AA shows my how my base case expectations drive top-line growth of ~7% over the next decade, and net income growth of 11.6% , with EPS expected to grow faster at 16%. ROIC is expected to gradually improve towards 19%, above the prior peak as specialty share becomes a larger proportion of the business. D/EBITDA expected to remain 2.0x long-term with most of the excess cash expected to be returned to shareholders.
My base case suggests that fair value is $511/share, which is a ~34% discount to current price of $355/share. In other words, I expect that an investor today could earn a 12% annual return over the next decade. Exhibit AB shows a screenshot of my DCF output tab.
Alternative Scenarios
In the two scenarios, we adjust a few key drivers including OEC fleet growth, the share of specialty revenues, margins, and SG&A leverage.
Bull (14% 10Y IRR) – Sales are expected to grow at 7.5% CAGR vs 14% historically. Gross Margins are expected to reach 45%, up from the prior peak of 43% in 2014. Specialty Revenues are to reach 33% of revenues in 2031 vs 22% in 2021. Gross Profits are expected to grow at 8.4% CAGR and EBITDA is expected to grow at 9% CAGR.
Bear – (8% 10Y IRR) – Sales are expected to grow at 1.9% CAGR vs 14% historically. Gross Margins are expected to match 43% in-line with the prior peak. Specialty Revenues are to remain flat at ~23% of revenues in 2031 vs 22% in 2021. Gross Profits are expected to grow at 4% CAGR and EBITDA is expected to grow at 4.6% CAGR.
Conclusion
URI is the leader in a fragmented industry that is being consolidated and has a long list of competitive advantages that should help them continue to take market share over the next 10 years. The business is exposed to economic cycles, but an increasing proportion of it is becoming more stable/resilient. Capital spending can be rapidly cut during periods of economic turmoil which should leave leverage manageable throughout a cycle. My analysis suggests that the gap between the current price and fair value is reasonable and that this business stands out as one of the few which I believe could have a stronger moat in a decade than today as it continues to expand.

