Floor & Decor (NYSE:FND)
Floor & Décor Holdings is a leading hard surface flooring retailer in the US.
Investment Thesis
Floor & Décor Holdings (FND 0.00%↑) is a leading hard surface flooring retailer in the US. The company sells luxury vinyl tile, laminate, hardwood and natural tile flooring to residential and commercial end markets, with a 95%/5% split of revenue respectively. The top 5 players in US flooring have ~44% market share, with FND sitting in third place at ~9% share. FND’s main competitive advantage over the long-tail of smaller players is scale. Although the other four main competitors also benefit from scale, FND has been able to differentiate themselves from their larger competitors by the following:
Larger stores allow the company to carry substantially more product SKUs and inventory on hand, which allows FND to fulfill immediate customer demand and provide more convenient customer services.
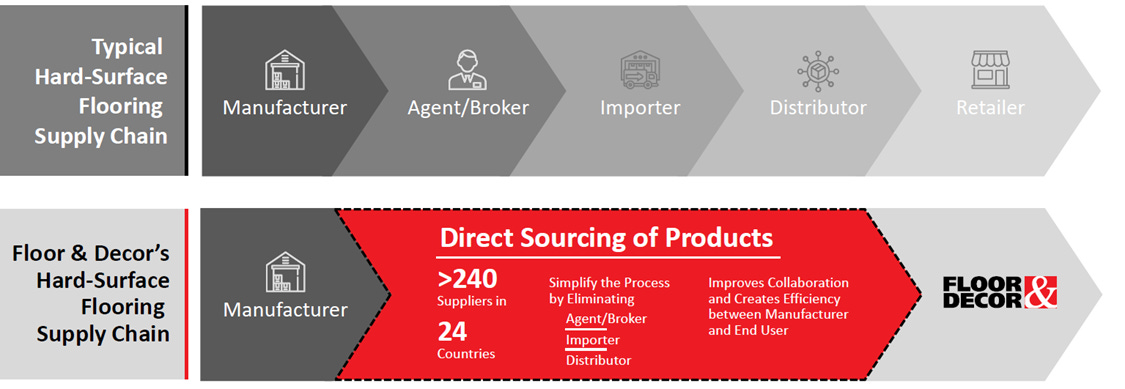
Scale allows FND to source product directly from suppliers, which reduces the use and cost of agents/brokers, importing partners and distributors. Some of those cost savings are shared with customers and helps support more competitive pricing.
Purchasing power over a fragmented supplier base. The company has >240 suppliers in 24 countries around the world.
Superior customer service, which includes dedicated service teams for professional customers, digital applications, a loyalty program, design services that provide customers with end-to-end help from envisioning a project to executing installation of a project, and a full offering of all equipment and additional supplies required to complete flooring remodeling projects.
A national footprint that should also allow them to meet the needs of larger commercial customers who operate across the country.
Other value-added services including free storage in store, a customer friendly return policy and financing.
FND has seen its market share increase to ~9% over the last two decades, and as they grow, they should continue to see incremental benefits from its scale. Consumer preferences over the past decade have demonstrated a preference for hard surface flooring relative to carpet due to hygienic, durability and aesthetic reasons. FND remains very well positioned to continue winning market share in the flooring market, particularly from the long tail of small competitors.
The company’s two largest competitors, Home Depot (HD) and Lowe’s (LOW) have taken an approach to prioritize high turnover and lower inventory levels at the store level to generate an attractive ROIC. Their utilization of middlemen keeps inventory at the supplier/partner level until they require it. FND in contrast, prioritizes higher levels of inventory and no use of middlemen which should generate a similarly attractive ROIC over time. I believe FND is well positioned to grow faster than the industry as it replicates its store concept in more markets in the US, and potentially in Canada over the long term.
FND’s large store size and focus on the hard surface flooring market drive a superior customer experience. The company’s direct sourcing model eliminates the utilization of middlemen, which are widely used across the industry, and as a result it can obtain superior pricing for its customers. FND’s stores are also built to inspire and encourage customer interest in new innovative products and design trends. The company’s ability to help customer design remodeling projects from a blank canvas is a substantial differentiator compared to peers. FND has also dedicated substantial resources toward meeting professional customer needs, which I believe is important given the frequency of purchasing and influence they have on end customers who only seldom purchase hard surface flooring.
Lastly, the management compensation framework is robust with long-term compensation based on a ROIC minimum of 17% and EBIT growth targets. Annual bonuses are paid out based on net sales growth and operating income. Equity ownership is low, but I believe the FND employee stock purchase plan (ESOP) is attractive and aligns the employee base with shareholder interests. I would characterize management as very strong operators and believe capital allocation has been strong throughout the leadership of Tom Taylor, current CEO. I believe that over time after the store footprint has been built out excess cash will be returned to shareholders through a combination of dividends and buybacks, and I expect they could repurchase ~56% of the float over the next decade as new store investment tapers off.
In the base case, I estimate that fair value is $85/share, which is in-line the current price of $86/share, and implies a 10-year TSR of 10%. In my view, the current share price represents a fair price for owning a high-quality business that has substantial reinvestment opportunities.
I’m still figuring things out, so feedback/comments on my assumptions or any of the analysis I have here is appreciated. I can be reached at icemancapital@gmail.com. Please see below for my DCF model, which has key assumptions built in.
Full Disclosure: I’m currently an FND shareholder, and may change my weight in the future.
Introduction to Floor & Decor
Floor and Décor (FND) is a hard surface flooring retailer which sells tile, hardwood, luxury vinyl planks and related décor to residential and commercial end markets. The company sells these products through 191 stores, 6 design studios, and ~100 commercial representatives. FND also sells decorative products, fixtures, shower doors and related installation materials. Exhibit A provides a breakdown of the company’s revenue sources by product type in 2022 and historical revenues on a company basis.
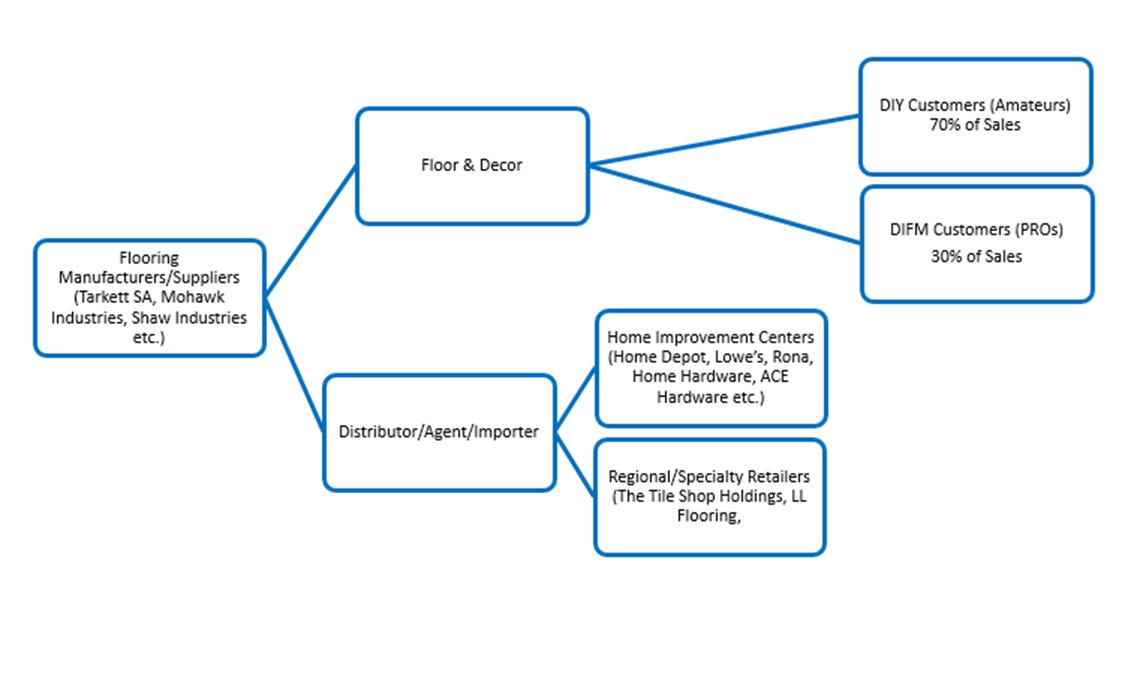
Before I dive into the business, it might be helpful to look at how the business model is set up (Exhibit B). FND starts with acquiring flooring and other products from manufacturers or suppliers. They then transport these products to its four distribution centers, which in turn prepare and re-distribute them to stores located throughout the US. At the stores, products are put on display on shelves, built into display vignettes, and eventually sold to customers. About 70% of products purchased in stores are from homeowners and the remaining 30% is completed by professionals. However, given the difficult nature of installing flooring products compared to other household remodeling needs, only about 15% of customers actually install the flooring product themselves –85% of customers rely on professionals to complete installation in their homes, offices, or workplaces. FND does not offer installation services, as they have deliberately decided not to compete with its professional customers. They have taken an approach to partner with the Installation Made Easy Network, which allows certified installers to provide quotes to the customer base – this can create steady source of new customers for professional installers.
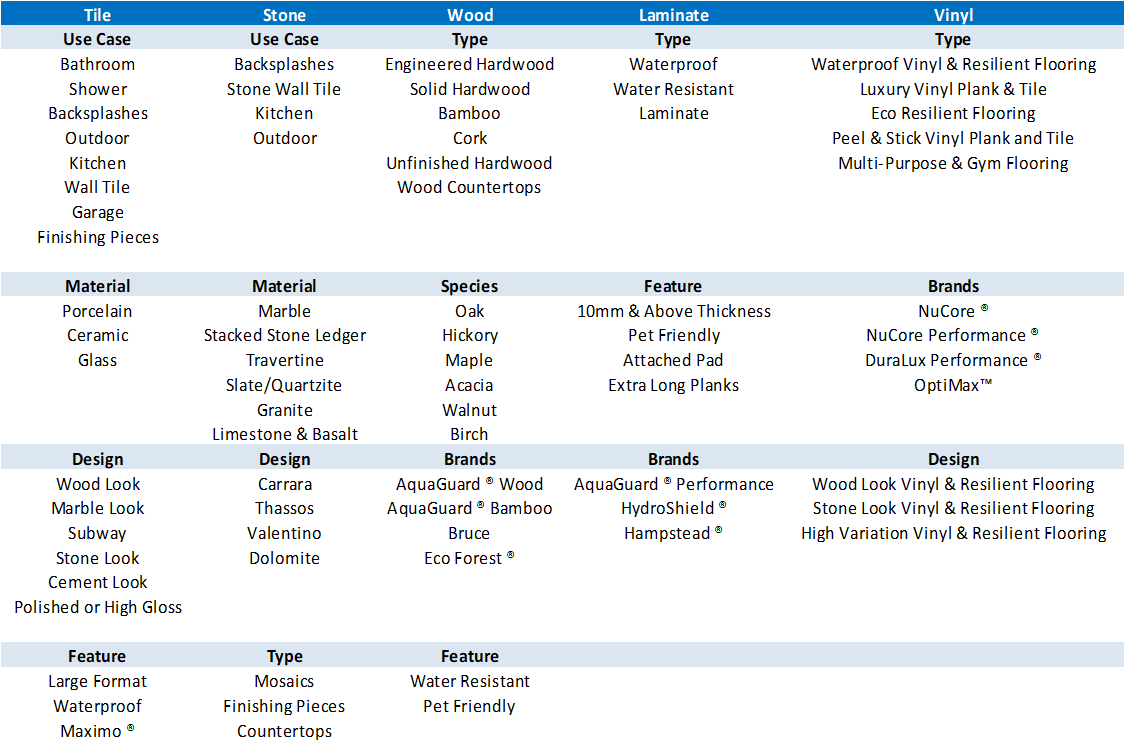
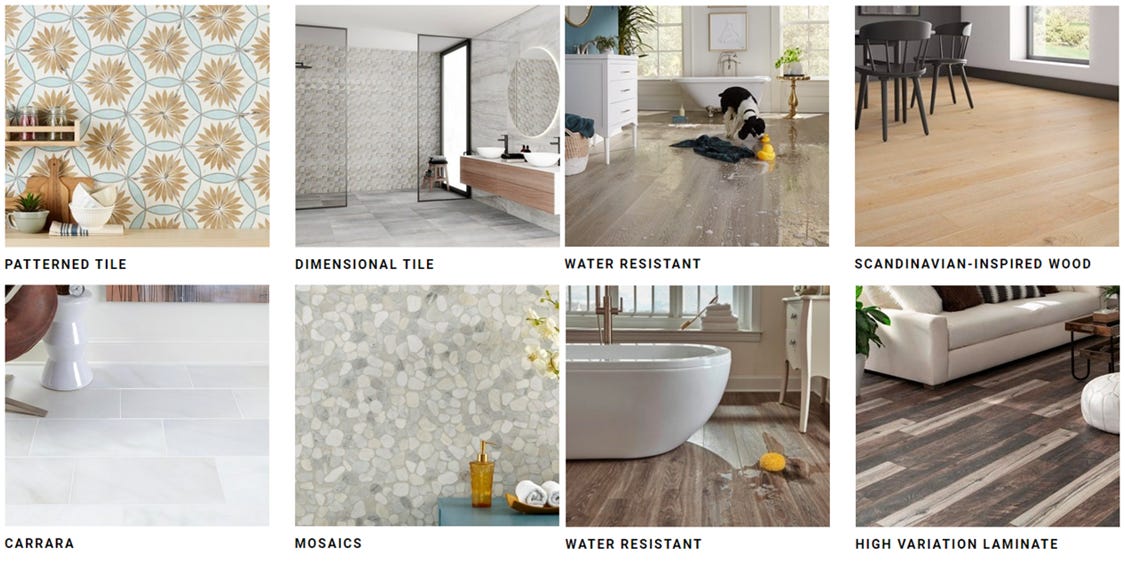
A sample of Floor & Decor’s portfolio of products is shown below in Exhibit C and Exhibit D along with different characteristics each of the product may offer. The company aims to provide a good, better, and best offering to meet a wide range of customer needs at different price and quality characteristics. Within each category there is typically a wide range of colors and styles customers can choose from. These flooring products represent ~80% sales for the company. The remaining ~20% is made up of installation materials, tools, and adjacent categories which include bathroom lighting, countertops, shower doors and faucets.
History
Floor & Décor was founded in 2000, by Vice Chairman Vincent West who opened the first FND store in Atlanta, Georgia. His vision at the time was to create a low price leader in the hard surface flooring market. In 2002, they opened their second store and in 2003 there was a management buyout in partnership with Saugatuck Capital and Najeti Ventures. Vincent left the CEO role at this point, and shifted to becoming an active board member. By 2007, the company had grown its store count to 23 stores in total.
Vincent West then stepped back into the CEO role in 2008 adding a higher emphasis on merchandising and advertising at the firm. Amidst a rapidly decelerating environment in 2010, ownership changed again with Ares Management and Freeman Spogli & Co. taking control of the business. In the 2010 to 2011 period, the company was known to sell whatever product was available & often at low end pricing points only. This shifted over time with the hiring of Tom Taylor in 2012, who began implementing a good, better, best product approach. Tom brought 23 years of experience from Home Depot (HD) where he was an Executive Vice President. He has had an impressive career at HD where he began working at the age of 16. After his time at HD, he spent 6 years with Sun Capital partners as a Managing Director serving on the board of directors of ~20 companies in the USA & Europe. I believe his time at Sun Capital refined his capital allocation skills and allowed him to learn about a wider range of business models and strategies.
Under the leadership of Tom Taylor, the company went through a significant reinvestment period. Tom began to build up the management team and processes to improve per store economics and position the company for strong store growth over the long term. Results were encouraging with average sales per store doubling from 2011 to 2016 and further differentiated the company’s value proposition in the hard surface flooring market. The majority of the current executive team was hired during between 2011 to 2014, including Trevor Lang (President), Bryan Langley (EVP & CFO), Brian Robbins (EVP, Business Development Strategy), David Christopherson (EVP, Secretary and General Counsel), and Steven Denny (EVP, Store Operations).
This management team supported growth in the store base to 39 stores by 2013. In 2014 the company re-launched its website FloorandDecor.com and emphasized its Omni-channel strategy with its customer base. At this point, the company had strong store growth momentum and recent trends which led them to file an S1 and prepare for an IPO. The environment for IPOs unexpectedly decelerated for multiple years after this, and peers like Lumber Liquidators were facing elevated levels of scrutiny due to concerns of higher than acceptable levels of formaldehyde, a known carcinogen in many of their products which drove concerns across the industry.
From 2014 to its eventual IPO in 2017, the company continued to build on its processes adding additional distribution centers, running multiple experiments on stores on characteristics like size/location, staffing levels, and implemented a newer CRM system to empower its retail employees. FND began to prioritize Professional (DIFM) customers adding additional employees to serve this group, and eventually adding a robust loyalty program to increase the stickiness/frequency of visits from this group of customers. In 2017, they finally completed their IPO at $21 per share, and interest in the business was remarkably high pushing the stock up 44% at open, and 53% by close. The capital raised was utilized to pay down debt and provided additional capacity to continue investing into its supply chain and store growth.
As a public company FND continued to deliver strong store growth and same store sales growth which averaged 11.1% from 2018 to 2022. Total stores had grown to 191 up from 100 at the end of 2018. During pandemic, execution at the company remained very strong, and in-stock levels remained high relative to peers allowing the company to capture much of the incremental demand for remodeling during this period. Then in May 2021, the company completed the acquisition of Spartan Surfaces for $90m, which expanded its addressable market to include the commercial flooring market that had an estimated size of $13b at time of acquisition.
Flooring Market Overview
Cyclical but Structurally Growing Market
The US Flooring industry has grown at a 2.7% CAGR from 2001 to 2021, as shown below in Exhibit E. Within that period there have been clear periods of cyclical growth including 2001 to 2006, and the gradual recovery from the 2010 trough to a likely peak in 2022. Expectations are generally for a slow-down in industry wide sales but their does not appear to be much consensus at what specifically that draw down could be in 2023 or 2024. Repair and remodeling demand was inflated in 2021 and 2022 driven by low interest rates, an aging housing stock, above average housing turnover, and growing interest from consumers to upgrade their homes. If I look at the sheer number of flooring retailers in the US, this has gradually declined as market share has shifted to home improvement centers, warehouse clubs and specialty retailers such as FND. As shown below in Exhibit E, industry wide sales have been accruing to a smaller number of stores in the USA.
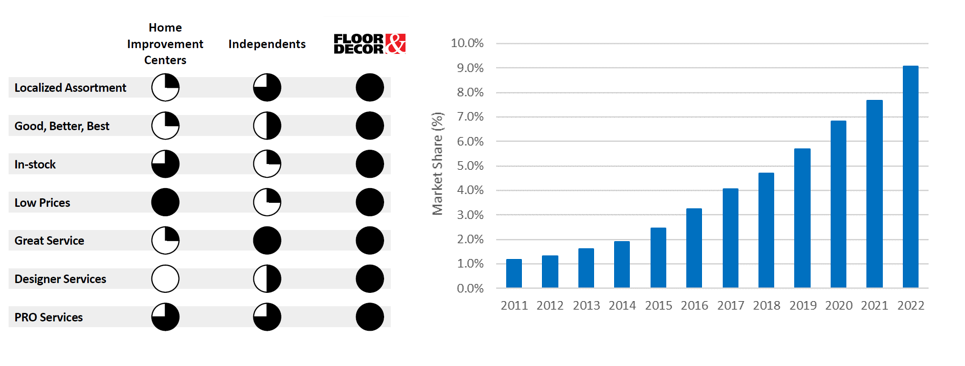
The company’s overall addressable market is broken down into about 5 different competitor categories including regional retailers, home improvement centers, distributors, specialty retailers and other retailers. F&D estimated that Independent Retailers and Home Improvement Centers held ~2/3rds of the market in 2022 as shown in Exhibit F. FND believes they have been gaining market share from all other areas of the market and I estimate had 9% market share in 2022.
In the industry, the biggest shift amongst competing products has been the rapid volume growth and share gain of Luxury Vinyl Tile (LVT) which has largely come at the expense of Vinyl Sheet, Carpet, and Hardwood. This has only occurred in the recent few years despite this product being introduced to the market in the early 2000s – it was only lately that the design quality, installation ease, and durability performance reached a breaking point allowing it to be installed into many more settings.
“Flexible luxury vinyl can be installed in any room of the home, even bathrooms and laundry rooms. So long as the subfloor is properly prepared, there are not many places where flexible LVT can’t go,” shared Jenne Ross, director of marketing, Karndean Design flooring.
Blakley Satterfield, residential product manager, Mannington, said that traditional LVT is ideal for large rooms, multi-room installations and open floor plans. Additionally, the ability to be installed without transition strips makes it ideal for homes where residents use walkers or wheelchairs. Other benefits include the ability to install cabinets on top of the floor for faster, easier install; ability to be installed with or without grout; and, availability in both plank and tile formats. And due to its durability, flexible LVT is suitable for environments with heavy rolling loads, such as healthcare settings.”
Exhibit G shows that industry sales grew at an 3.6% CAGR from 2008 to 2021. Hardwood grew at a 5.8%, Ceramic & Porcelain Tile grew at a 4.0%, followed by Stone which had a +2.7%. The two slowest growing categories were Carpet +0.7% and Laminate 0.4%. LVT on the other hand grew rapidly over the latest 6-years, where it began to be categorized separately and can see accounted for much of the industry wide growth. On a volume basis, trends were relatively similar in most categories, and industry pricing appears to have increased at a ~150 bps CAGR suggesting little to no pricing power in excess of inflation across the industry. The one outlier trend on a pricing per square foot basis was LVT which has seen a decline in per square foot costs during the last 6-year period. In the past 5 years, there have been qualitative improvements to LVT products, and a relative pricing improvement to alternatives, which I believe explains why it has outperformed most of other hard surface flooring alternatives.
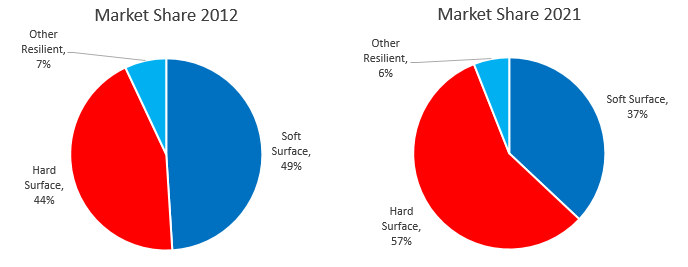
If I look at broader trends including each of the products into broader labels, I can see that hard surface flooring products have won market share from soft surface flooring products. Hard surface market share grew to 57% of the market in 2021, up from 44% in 2012 as shown below in Exhibit H. I believe this has been driven by consumer preferences shifting towards products that are easier to clean, more durable, and have a wider range of design options.
The average life expectancy is longer for hard surface products, which combined with its better price point and easier to maintain characteristics explains why it has been gaining share in the market. This shift has been beneficial for industry growth over the past decade but as the rate of change of market share decelerates so should hard flooring growth. As a result, the average life expectancy of all installed flooring should go up creating potential headwinds for hard surface flooring in the next decade. The average age of flooring in US homes today is likely below longer term levels.
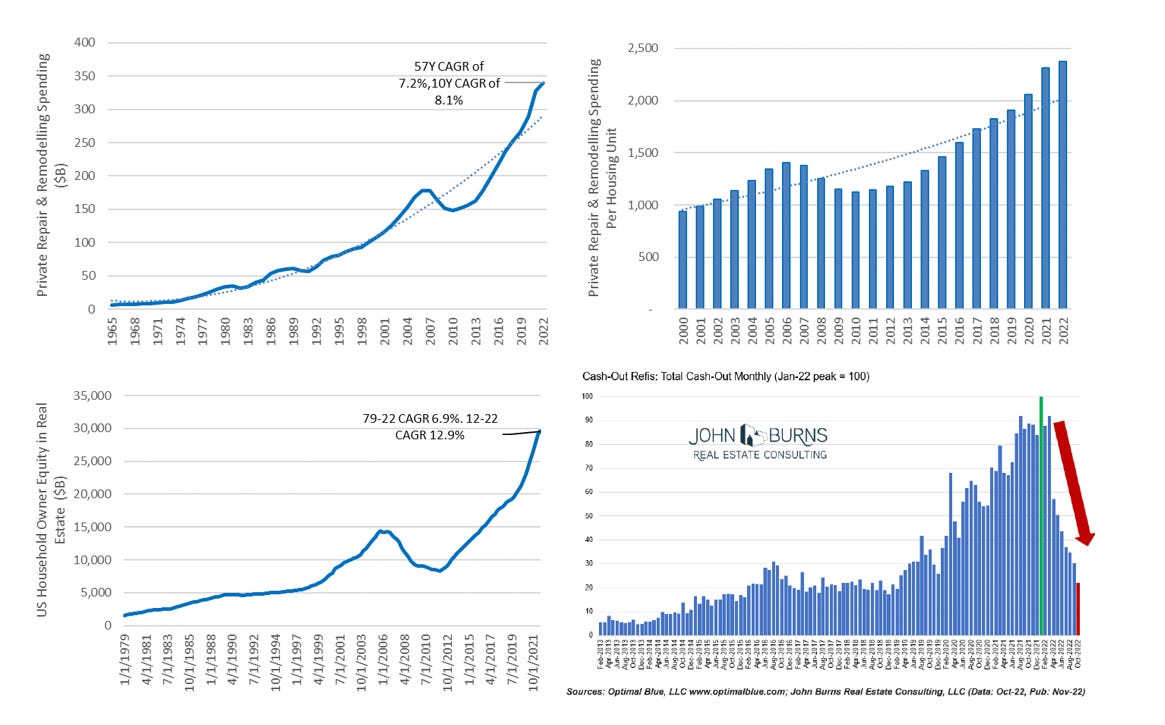
Homes in the US have steadily appreciated as interest rates have declined. According to the Case-Shiller Index, the average single family home price has grown at an 4.4% CAGR going back to 1987. Home prices in the US peaked in 2006, then fell by 27% into 2011, as shown in Exhibit I. From the beginning of 2012, to Q4 2022 the average home price grew at an 7.4% CAGR approximately, 550 bps ahead of inflation. 30Y mortgage rates have increased 360 bps from a low of 2.7% early in 2021. As a result, housing prices appear more likely to decline (at least in select markets) rather than increase as they have the past decade.
Below J show that Repair & Remodeling Spending has grown slightly ahead of home prices at an 8.1% CAGR the past decade. There is evidence of at least some pull forward of demand during 2020 to 2022 as average spending was up 20% from 2019 levels. On a per housing unit basis, it was up 55% when I compare it to the prior decade average of $1,452/house. To fund these expenditures consumers increasingly drew on home equity lines but this trend has appeared to reverse rapidly since reaching a peak in January of 2022 – it appears unlikely that this is a future source of funding given the uncertain economic outlook and the rapid deterioration in consumer sentiment levels in the past 12-18 months.
Competitive Landscape
Floor & Décor operates in a competitive but fragmented market. The two largest competitors are the two home improvement giants Home Depot (HD) and Lowe’s (LOW), which generated flooring sales in 2021 of ~$8.4b and ~$4.9b, respectively. After these two, Floor and Décor is the largest individual flooring retailer by sales in the US, as shown in Exhibit K. The industry is relatively fragmented with the top 5 holding ~44% market share but independent’s such as family-owned entities or regional players still represented ~53% of industry sales. FND management has highlighted in the past that they believe they have been winning market share from multiple areas due to its attractive value proposition, and industry trends towards hard surface flooring products.
Floor & Décor believes it competes very well with Home Improvement Centers and Independents on a range of factors including low price, service offerings, and depth/breadth of products in stores as shown in Exhibit L below. Many have called FND a category killer, and if FND can maintain these advantages vs competitors I see a high likelihood of retaining this title for years to come.
A comparison of square footage dedicated to flooring is outlined below in Exhibit M based on recently reported store counts for peers – this highlights FND’s economies of scale relative to peers. Longer term I see the gap relative to peers expanding as it reaches or exceeds its 500-unit growth target. As shown below, in Exhibit M they will have ~2x the dedicated square footage dedicated to retail flooring vs the combined square footage of all public peers. I expect this to drive purchasing power advantages over suppliers who are fragmented across the world. Both HD & LOW generate superior sales per square foot on a relative basis as their business model prioritizes keeping inventory at the supplier level and only holding products on the books that have higher turnover.
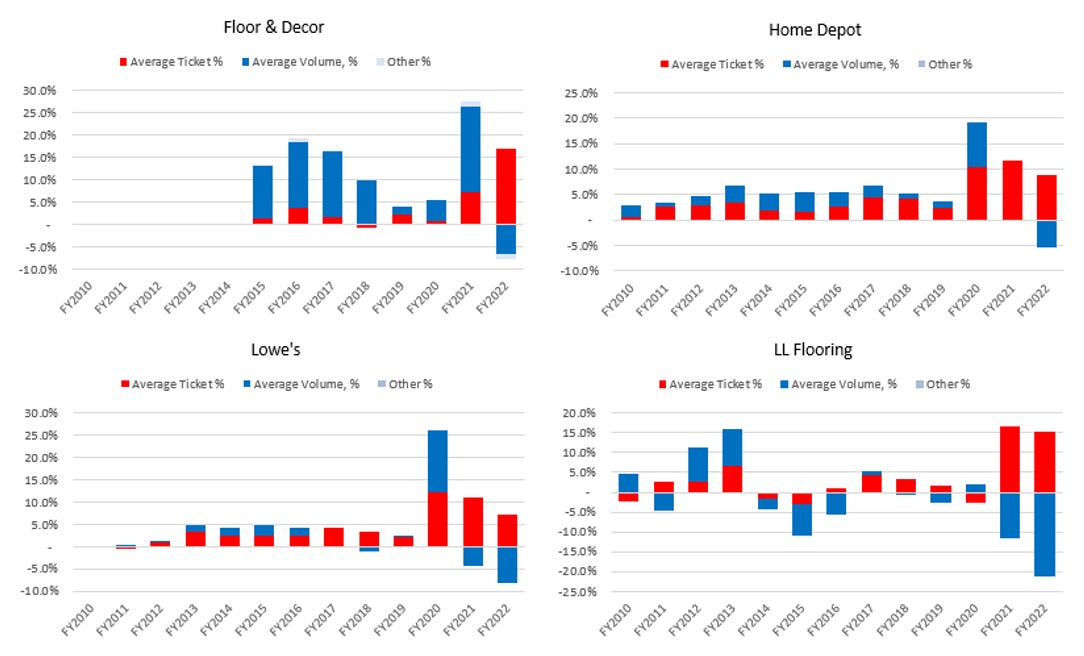
Below in Exhibit N, we show a breakdown of recent same store sales trends for FND and peers. This shows that for most of the large industry players, they saw above average positive impacts from higher ticket pricing starting in 2020. If we compare FND to LL flooring, we can see FNDs outperformance has largely been driven by higher volume growth.
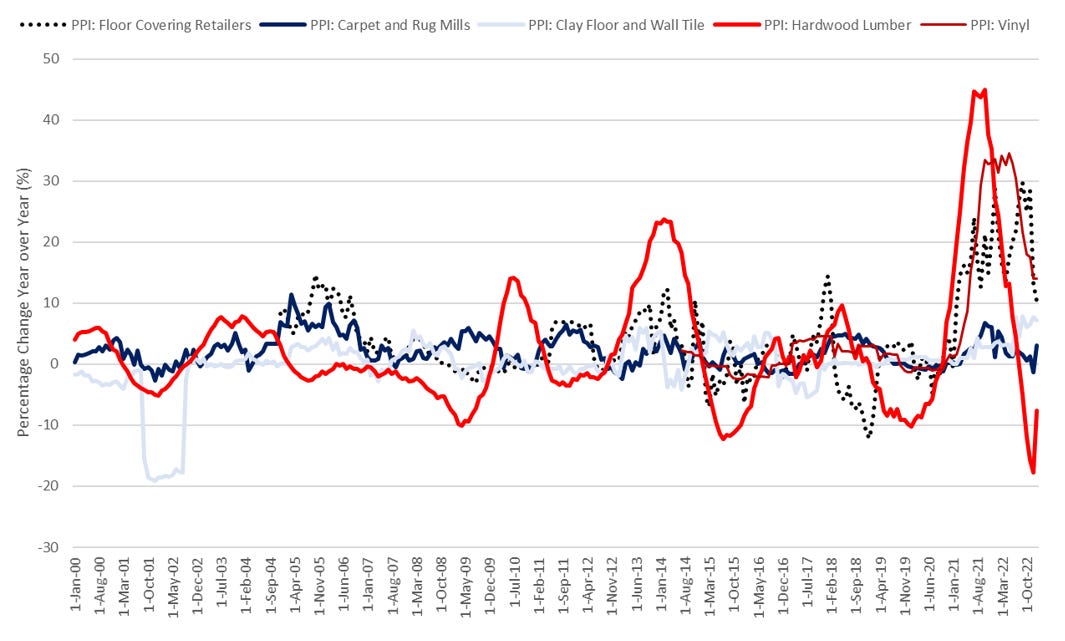
PPI data shown below in Exhibit O shows the different product categories levels of inflation going back to 2000. This shows that that inflation in the industry was largely driven by hardwood and vinyl products – and as of early 2023 inflation growth rates have decelerated from peak levels seen in 2021 and 2022.
E-Commerce Threats
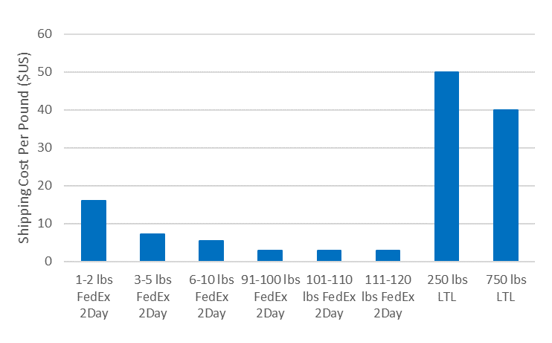
A discussion of a retailer in the US is not complete without addressing potential risks from Amazon - but to start I don’t believe there are any immediate threats from them encroaching into their core market. I believe this is driven by a few notable factors including the immediacy of the product for the biggest customer – PRO’s may be interested in products on AMZN, but if they are not available when, and where they are needed this can create working capital challenges, and can delay execution of planned projects. At FND stores, they can be assured they will leave the store will a full lot of product or installation materials if that is what they need. Second, I believe most consumers want to see and feel most products they are about to have installed into their homes for 10+ years, and if pictures or online visuals do not match consumer expectations this can lead to significant customer dissatisfaction. I would note that AMZN, and many e-commerce retailer’s business models are more oriented around smaller, high value products or those that are relatively standardized (i.e. books, home & kitchen goods etc.). Flooring is heavy, low value and is not standardized amongst different retailers – generally consumers are not aware what the best in class brand for hardwood or laminate products is today given the infrequency of purchasing. Below in Exhibit P, we highlight how heavier products are substantially more expensive to ship - FNDs business model is largely to distribute to the stores, and not to individual households. As a result, it can spread out these higher distribution costs, and offload potential last mile delivery costs to the customer who would typically pick up the product from stores.
I believe consumers are more likely to purchase cleaning products, or floor protectors from AMZN which are not core products FND focuses on. Additionally, with the marketplace offering, AMZN takes limited/no responsibility for the quality of the products it sells – flooring you purchase on the marketplace may not actually pass the quality, and safety requirements FND’s merchandising team would have for products that are sold in stores. As of last quarter, about 18% of sales at FND was through their website – but I believe this figure is actually inflated relative to reality as it is mostly being done by professionals who have installed a particular product before, or customers who plan on picking up products from a store along with verifying visually that this is the type product they were looking for. Overall, I just don’t see it as a great fit for AMZN and believe this is a not a material risk for FND in the near to medium term – however, things can change and we think it is a risk worth monitoring going forward.
Long Term Store Potential
Back in 2014, when the company filed its first S1 filing, management expected over the next 15 years it could reach 350 units. At this time the average store size was 70,000 square feet. Then by 2017, management increased this target to 400 units and estimated its average store size at 72,000 square feet. In 2022, management highlighted it aspired to reach 500 units’ vs 191 at YE2022 implying only 38% build out relative to estimated white space for the business.
Previous managers and executives in the industry have highlighted that they believe FND could actually reach more than 500 and potentially 1,000 on the very high end, which is still modest relative to HD & LOW store counts of ~2,000 and ~1,700, respectively in the US. I believe this going to be driven by incremental density of the store count, with a greater proportion of stores being opened in existing markets – this has already begun to shift, as ~50% of stores opened now are occurring in existing markets compared to 30-35% in 2017. Another area where management could expand could be Canada, where I expect they could easily end up with 30 to 50 stores based on population density analysis shown below in Exhibit R. Canada has roughly the population of California which has 27 stores today & we don’t believe FND has completed its unit growth in California yet. Alternatively, we can extrapolate from managements 500 store target which implies about 3.5 stores per million households – this suggests a potential store base of 56 units in Canada higher than the range that our population density analysis shows. I expect that over the next 5-10 years’ management will continue to revise their long term target higher. I think there is also the possibility that they continue to experiment with some different store sizes, and I see a high possibility of the introduction of a reduced size format which may result in a larger proportion of new store opportunities in smaller markets.
Commercial Market
FND has historically prioritized reinvestment into the retail market, but this changed in May of 2021 when it decided to accelerate/improve its positioning in the commercial market with the acquisition of Spartan Surfaces (SS). Historically, FNDs commercial sales business had been growing steadily, up 6x in 2021 vs 2018 levels – the firm had sales skewed towards general contractors, owners, builders and developers. The addition of Spartan Surfaces added the capabilities to meet the needs of Architectural and Design (A&D) firms who have more complex needs such as pre-build design support, strong specification expertise, and turnkey installation coordination capabilities. Through this deal, FND was able to grow its addressable market from $6b to $13b and through additional investment since now has an addressable market of $16-17b, as shown in Exhibit S.
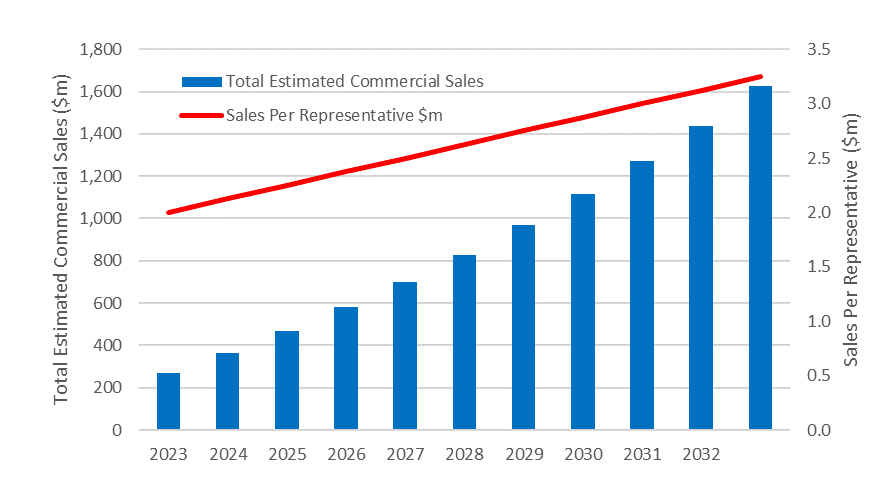
We think the deal created value through multiple levers. Through the consolidation, Spartan Surfaces and FND employees were able to access much deeper and broader product catalogues for their customer bases. This deal also allowed Spartan to obtain products at a lower cost due to the historical investments the company has made to build out its direct sourcing model. As the two businesses are integrated we would expect some incremental utilization benefits from existing warehouse capacity and over time would expect new Spartan sales offices opened will benefit from legacy investments FND has made. Tile has not been offered historically by Spartan, so there is also the potential to add this to their portfolio given FND’s expertise in this area. The main offset from expansion into the commercial market, is lower gross margins roughly in the high 30s compared to FND retail gross margins in the low 40s – despite this, we think the commercial business can still generate robust ROICs due to lower working capital and lower SG&A requirements. FND has a long runway to grow as sales grow to $3-4m per sales representative (RAMs), collectively this could result in sales of $1.5-1.8b at maturity.
“Floor & Decor’s extensive sourcing and distribution capabilities of innovative, trend-forward products will serve as a key selling point for our business development team and for projects that depend on reliability and near-term supply. As we look to the future, we are excited that Floor & Decor has the experience and resources to help us accelerate our growth plans into many untapped and highly fragmented markets across the United States, while maintaining our unique culture.” Kevin Jablon, Founder and CEO of Spartan Surfaces
Unit Economics
We believe FND generates robust unit economics. Throughout the firm’s history, they have taken an experimental approach to tweaking how they are replicating the model across the country – I believe this approach is borrowed from Tom Taylor’s experience at Home Depot. In the early 2010’s the company invested around $3.5m into a new store, and would expect to generate $9m in sales the first year and $0.9m in EBITDA, as shown in Exhibit T. By 2016 the company was able to steadily reduce the net working capital for stores by extending out payables to suppliers and Pre-Opening expenses grew modestly. In 2022, FND made arguably the biggest change they have increasing capex by 3x to ~$7-9m, and prioritizing ownership of the stores. So far, the incremental investment is generating superior returns and sales of the new format are $4-6m higher in the first year and EBITDA is ~$1.6m higher. By the third year they estimate they are generating 2x the EBITDA of the prior model. This prioritization of ownership of the store should allow them to avoid substantial rent payments over the upcoming 10 years. The company has also highlighted the benefits from self-development which include a faster build time, ~15% cost savings and lower maintenance costs. As FND continues on this journey, we expect rent costs to fall as a proportion of sales – in FY20 it was 6%, we expect it to be in the LSD range longer term.
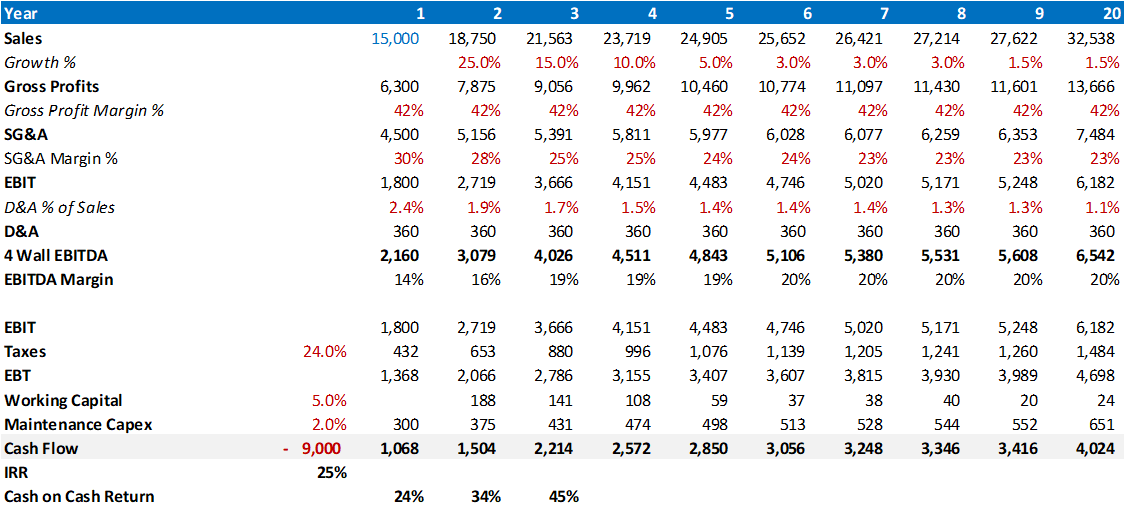
Below in Exhibit U we provide an illustrative overview of the per store economics assuming a $9m capex investment and straight line depreciation over a 20-year life. We assume gross profit margins flat at 42%, and SG&A margins at 30% initially but scale to 23% as sales mature over the forecast period. D&A assumption is based off a 20/year life for the building at $360k/annum. Collectively this results in EBITDA margins reaching 20% long-term. This results in an IRR of 25%, which we believe is very attractive and highlights the attractive organic reinvestment potential for the company.
Competitive Position
Advantage #1: A wider selection of hard surface flooring products and better in-stock levels
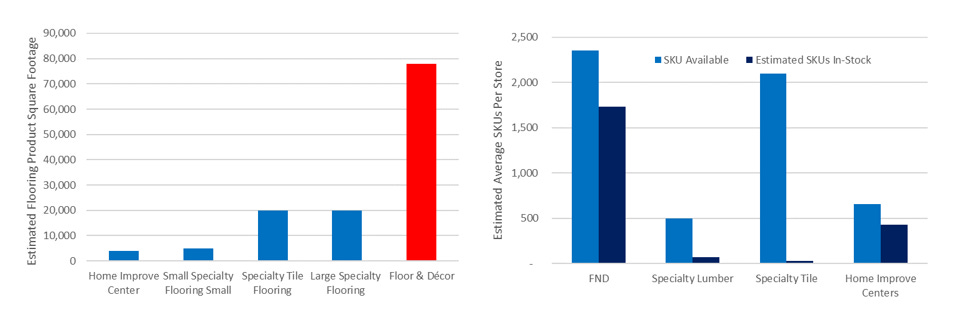
FND can offer customers a wider range of flooring and related products to customers because of its larger big box store format, as shown in Exhibit V. If we compare the square footage they dedicate to flooring products, it has 4-20x more space than peers and this increases the odds that a customer will be able to walk away from the store with a product that meets their needs & budget. For professionals, the higher level of in-stock levels ensures that when they are visiting a store they can leave with a full lot of product to complete an individual project. I estimate that >70% of the SKUs they offer would be in stock and the remaining 30% would be a special order from a DC. In the simplest terms, there are more products customers can choose from in FND stores and of the products they have in store, they are much more likely to have sufficient stock on hand.
Sales of flooring product for FND on a per location basis was ~$18m which was a magnitude of order different to peers who generate flooring sales per location of 2.5-3.6m. HD & LOW appear to Additionally, FND offers a range of ancillary products such as installation materials and tools which allow them to be a one-stop shop for customers.
“In a Floor & Decor, if you were to go into by tile, you would find in the average store over 250 options of tile. In home improvement center, you would find 55 to 60. So it's just --and the definition of in-stock in big box stores certainly different, right? We have multiple jobs in stock, we can earn PRO’s confidence, their trust they know the product is going to be there.” - Tom Taylor
“Floor & Decor offers more than four times against the specialty lumber retailer and home improvement centers. If you look at the numbers at the bottom, which compare in terms of in-stock assortment, you can take them home today. Floor & Decor has over 1,700 SKUs versus maximum 70 in the specialty lumber retailer against a maximum 50 in the specialty tile retailer and 400 to 450 in the home improvement centers if they have good jobs, lot quantity in stock. And independents usually don't carry in-stock assortment and they do a special delivery which could be two weeks plus to get it.” - Ersan Sayman
Advantage #2: Direct sourcing capabilities
FND is uniquely positioned compared to peers as they procure product directly from suppliers, eliminating the usage of a number of middlemen who all would have taken some form of commissions or markup on the products they would eventually sell to customers. This is an integral part of why FND is able to offer attractive pricing for products relative to the industry. Our research has indicated that generally prices are near or better than other retailers in many categories, and in select products like Tile, it is priced well below competitors. The Tile Shop often sells similar products for ~$18/square foot vs ~$6/square foot for products available at FND – while some of this can be attributed the quality differences I believe the majority is explained by a discrepancy in pricing strategies. In the flooring industry, the ability to find the same product at different stores is difficult given the wide range of products available in the industry. The company’s pricing philosophy is to have everyday low pricing, match competitor pricing, and notably will rarely utilize a promotional strategy to flex volumes which we believe creates a more consistent value proposition for customers compared to other approaches used by competitors.
Floor and Décor is able to pursue a direct sourcing model because it has expert merchants in house, and because it has reinvested over the past decade to build out its supply chain capabilities including 4 DCs and long term ocean carrier agreements. As FND has a more direct relationship with suppliers, this can allow them to more efficiently collaborate with them on new design trends, and increase the overall efficiency of both company’s operations. The elimination of middle men also reduces the time that product is held at various points before they eventually have it available for sale at stores.
FND is very often one of the biggest customers for a large number of small sized suppliers resulting in them having relative bargaining power. As newly opened stores mature over a 5-6-year period, this can drive above average volume growth for suppliers for a healthy period of time – then combined with actual new unit growth, it can create a situation where FND is almost always expected to be the largest customer for an individual supplier over time. We believe this leads suppliers to allocate supply when availability is tight to FND and illustrates why the firm was reported to have substantially better than industry levels of stock during the past few years despite supply chain challenges creating more difficulties for smaller retailers.
Exhibit W below compares the typical supply chain for independent retailers compared to FND’s.
Advantage #3: Differentiated Professional service offering (PRO)
FND has gone through a long iterative process to optimize its offering for professional contractors. Earlier in the company’s history, it was simply under invested into and had something like a makeshift bench made of cinder blocks & a few pieces of lumber, and a coffee machine. Since then, the proposition has dramatically improved to include a dedicated customer service desk, loyalty program, credit program, free storage & return optionality, phone applications, education events and delivery options. FND’s share of revenues generated from professional customers is the highest of the peer group as shown below in Exhibit X.
The PRO customers (DIFM) are typically Flooring Installers, General Contractors or Homebuilders with a median age of 50 years. Most of these customers have a relatively small operation with the majority generating less than $1m in sales per year and a median of only 3 employees. FND estimates that professional’s influence nearly 40% of its sales – that is, suggesting their brand or a specific location to customers when they are going ahead with its research & buying process.
Similar to many retail concepts, a few power users or high frequency purchasers can disproportionately impact per unit profitability. FND estimates that 59% of PROs are enrolled in the loyalty program so far, and this proportion has been growing since the launch of the program. Customers in the loyalty program spend near 3x the amount compared to PROs who are not part of the loyalty program. Additionally, trends remain supportive in early 2020 FND management highlighted that the top 10% of professionals did purchasing of 37 projects per year with FND and average spending was up 24% in 2021 vs 2020 levels.
In our discussion with industry experts, I discovered that it takes multiple years for FND to attractive professional customers from the point when they initially open stores due to the difficultly in marketing directly to these types of customers. Conversion rates appear high once customers are in-stores, however, with PRO’s purchasing >90% once in store and homeowners >80% once in store. This, in our opinion, is indicative of brand awareness continuing to improve throughout the US. Once these relationships are developed we believe customer satisfaction is generally quite high based on our discussions with industry executives and a comparison of NPS data from comparably.com, which is shown below in Exhibit X.
Advantage #4: Merchandising Expertise
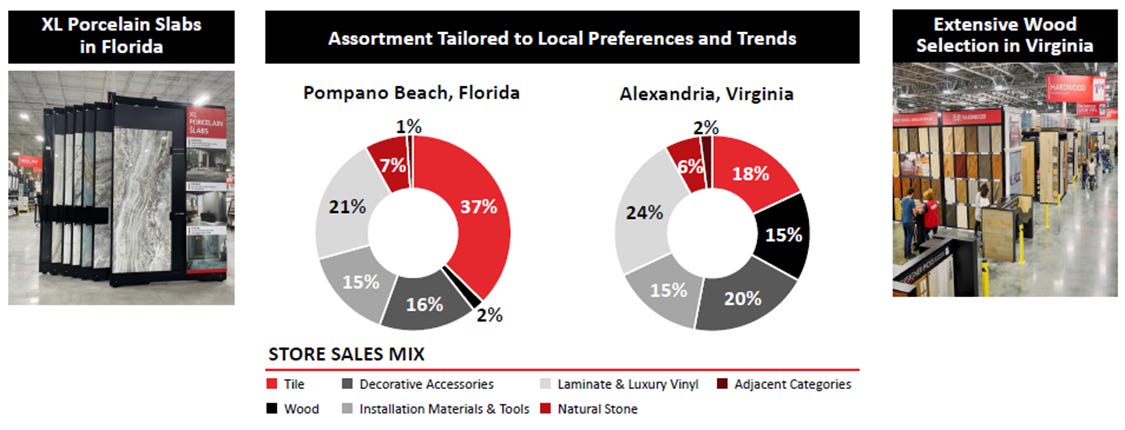
FND’s operates a decentralized store model, and inventory is optimized by local managers to ensure products on display and in stock meet consumer preferences in that region. The company’s large store size and diversification across multiple products allows the company to adapt with design trends. If we compare this to specialty lumber or specialty tile retailing peers, they are unable to do this – The Tile Shop can switch the designs, colors and quality of the tiles it sells but it can’t maneuver into Hardwood if this becomes the latest trend. Exhibit Y below highlights how the company’s product mix has changed since 2012.
EVP, Ersan Sayman has been with FND as a merchandising manager for > 18 years, and leads this function at the firm. FND has built an approach to keep product leaders within the same category for as long as possible – IE) John, who has run tile sourcing for the firm will continue to run it and build his expertise in this area. Other product leaders will focus in other product categories. Specializing in one particular product category allows product leaders to develop continually year by year and develop strong relationships with the supplier base. FND also benefits from this as it continues to grow its private label portfolio – which has entry, good, better and best product offerings points as shown below in Exhibit Z.
The company has broken down this product mix setting process into 6 major components. First they have merchants actively researching trends, attending flooring shows, meeting with vendors, and reviewing competitor offerings. Then after collecting all of this information, they work with their manufacturer and design partners to create products, branding and packing. These new products are then presented to the regional merchants who are actively living and working in the specific markets. Managers are not left to make these decisions themselves – an inventory team, and store merchants review these suggestions and provide feedback to the merchandising group. Ultimately, demand is aggregated across the store base, products ordered and manufactured. Then, when the product finally arrives at the stores, it’s put on display, and potentially presented to consumers in vignettes. FNDs ability to merchandise, and localize assortment effectively is a difficult to replicate process. Exhibit AA shows the different sales mix from two locations, which are notably different and match local preferences.
Advantage #5: Superior customer service offering
FND stores have been well designed to meet customer needs when they come into a store. This is driven by the setup of the floor space which drives traffic through the store and inspires customers. ~2,300 square feet per store is dedicated to vignettes which are refreshed roughly once per year. If HD or LOWs attempted to match allocation toward vignettes within their stores, this would consume 40% of the entire flooring department which would materially reduce the depth/breadth of their flooring offerings and reduce sales per square foot metrics.
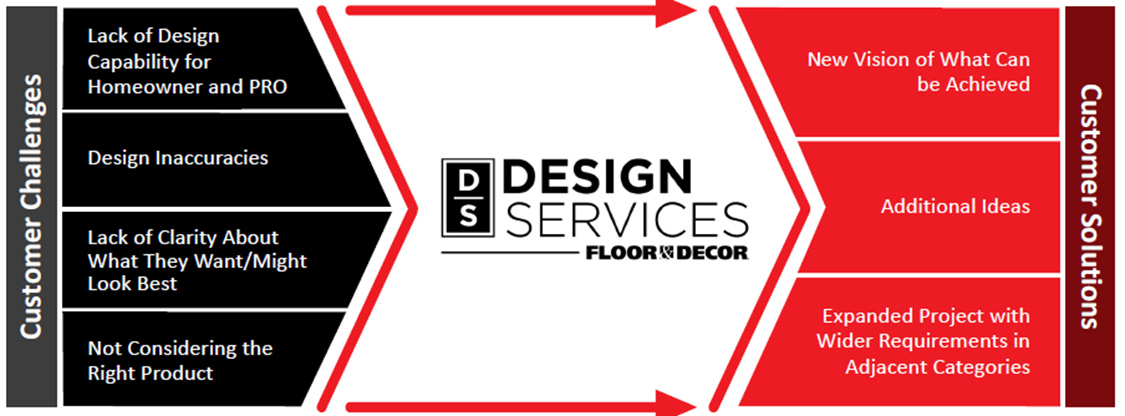
The company’s Free Design Services which are offered by flooring dedicated experts is a substantial differentiator in our perspective. This group of specialized design employees has an ability to work through projects from initial vision all the way to completion. The benefit of this group is that they can make recommendations for customers that meet their budget, lifestyle, and quality needs, as shown in Exhibit AB. This translates into superior customer satisfaction ratings, better sales conversions and ~2-3x higher total ticket vs non-design customers. Within each store this would include at least 4 full time employees on this function. We believe this is very positive for its relationship with PROs who rarely have design personnel on their staff. Across four different service metrics measured at FND regularly, the design services appointment is considered to be amongst the biggest positive contributors. Management has continued to talk up potential of reinvesting further into this offering – even for its employees it has created multiple roles within this department allowing them to specialize, and grow their career within the firm.
On the technology front FND has also reinvested to ensure its associates are enabled to communicate internally, digitally manage tasks like quotes, adjust inventory, and optimize routing of products. All-in this minimizes time employees are spending on the administrative & upkeep activities and can allow them to spend more time with customers who need assistance when they come to the stores as products are bulky & difficult to move. The company has also set up its order fulfillment processes to ensure substantial customer visibility – each interaction is aimed to be connected and convenient for them. Below in Exhibit AC, is a summary of how the overall service offering compares with a few competitors. While PRO offerings are common across the industry we think the difference compared to a Home Improvement center is material, as the individuals on those professional desks are expected to be an expert across multiple departments and a SKU count of >35,000 compared to mostly flooring products and SKU count of ~2,400 at FND. Within Floor & Décor stores it is an expert to expert discussion not expert to generalist which should lead to higher levels of satisfaction. Other retailers generally offer installation services which FND has deliberately decided not to do as they do not want to compete with customers and instead prioritize being the go to supply house for its customers. Ultimately, all these factors combined leads us to believe they have a substantially differentiated offering vs peers.
Management & Governance
Tom Taylor, has been CEO since IPO and only the 2nd CEO since inception of the firm. From a strategic perspective, we believe he has focused on the right pillars to improve the competitive position of the business for the next 10 years. The biggest change has been the build out of the company’s direct sourcing model, expansion of its supply chains capabilities, and reinvestment into PRO offerings. Collectively, these changes have improved the value proposition for its core customer base and differentiated it vs peers.
After 23 years at HD, he had built a strong record of progressing into new roles and creating value. Co-founder Bernie Marcus identified Taylor as a young prodigy, and was an ongoing mentor during his time with the firm. He was the youngest manager they ever had, by age 26 he was a district manager, a very rare feat. Tom continued on in various senior roles at HD and eventually ran merchandising responsibility for all of the Home Depot stores. Even when he left HD, he continued to provide consulting services to them for two years – highlighting how the immediate loss of him could have been disruptive to the firm.
One of the few things I don’t love about management & governance is the lack of meaningful insider ownership, which is likely due to its shorter history, but even the founder, George West owns little stock.
If we look at the compensation structure for management, short term compensation policy is well structured as it is tied to Net Sales and Operating Income Targets. Longer term incentives are reasonably structured with RSUs and PSUs tied to adjusted EBIT and ROIC targets over a three year period. In 2020, the management has also received one time awards over the past few years tied to delivering EBIT, ROIC and relative to peer TSR into 2022. Like many employers the company also added an Employee Stock Purchase Plan, which allows employees to receive stock at a 15% discount to the market price over each 6 month offering period. All said, there are some areas for improvement, but the overall structure is reasonable enough & unlikely to impair our ability for the thesis to play out.
Valuation & Scenarios
Revenue Expectations
The primary driver for FND growth is unit count, same store sales growth and commercial sales growth. Into 2032, we expect FND to continue opening stores reaching a peak pace of 35/per annum and gradually decelerating to 27 stores per annum by the end of our forecast period due to market saturation. Then for the existing stores base we expect MSD SSS% growth to drive average store sales to $28m by the end of our forecast period up from $24m in 2022. Over time we expect new stores to be gradually more productive relative to mature stores as brand value builds across the USA. Our expectations for total revenues, net new store openings and mature/new stores sales are shown below in Exhibit AD
For commercial sales, a small portion of overall sales today, we expect this to grow rapidly as FND continues to add sales representatives in new markets, as shown in Exhibit AE. By 2033, sales are expected to reach $1.6b up from an estimated $0.3b in FY23 largely driven by growth in the number of representatives from 100 to 500 by the end of the forecast period and maturation of the sales force to reach a ~$3.3m per annum sales rate.
Below in Exhibit AF, we expect gross margins to continue improving over time as buying power grows and mix improves. This results in 43% gross margins at the end of our forecast period vs 40.5% in FY22. For operating costs, we forecast a smaller impact from pre-opening as the pace of new stores opens declines relative to the store count. Then for selling and operating costs and general and administrative costs we expect this to decline to the high-20s as stores mature, and centralized costs are spread out over a larger sales base. This results in EBITDA margins of 15.2% in FY33 vs 12.9% in FY22, driven by a improving gross margins and operating cost leverage.
This collectively leads to GAAP Net Income CAGR of 14% during our forecast period, with EPS growth expected at an 24% CAGR driven by buybacks where we deploy excess cash flow in our base case.
Sources and Uses of Cash
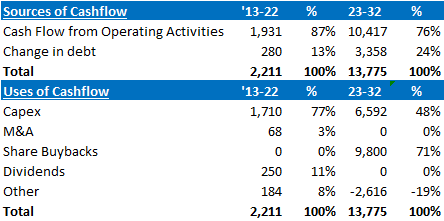
FND should generate substantial cash flow in the next decade, even as they reinvest, and growth the store base. There remains potential to consolidate in the commercial sales market where buying a competitor with strong relationships could meaningfully accelerate growth in this market but, we don’t model in incremental M&A at this point. We have the majority of excess cash being returned via buybacks beginning at roughly the midpoint of our forecast horizon. This is expected to result in an -8% CAGR for shares outstanding or a 56% decrease in the share count from 2022 levels. We consolidate the prior decade and our expectations for the next decade’s sources and uses of cash below in Exhibit AG.
Base Case Vs Historical Results
Exhibit AH shows my how my base case expectations drive top-line growth of ~11% over the next decade, and net income growth of 14% growth, with EPS expected to grow faster at 24%. ROIC is expected to gradually improve towards 22%, largely driven by falling working capital as the firm extends out payables over the fragmented supplier base. D/EBITDA expected to reach 2x long-term with most of the excess cash expected to be returned to shareholders.
My base case suggests that fair value is $86/share, which is effectively in-line the current price of $87/share. I expect an investor could still earn at ~10% IRR over the next decade based on my modelling. Exhibit AI shows a screenshot of my DCF output tab.
Conclusion
FND is a category killer and leader in a slowly growing & cyclical industry. The firm is well positioned to continue growing its market share over the next 10y, and competitors are not structurally set up in way to compete effectively with them. My analysis suggests the current price is in-line to fair value for the business and I still expect to generate an 10% IRR through ownership of FND, at the current share price. As always, feedback is appreciated.

