Overview
Fleetcor Technologies ( FLT 0.00%↑ ) is a global B2B payments business focusing on fuel cards, accounts payable automation, foreign exchange, lodging, and toll payments. These solutions collectively provide a faster, more secure, and timely way to execute the payments component of operating their businesses. Each solution they have shares a similar set of characteristics, including largely focusing on businesses as customers where spending is relatively predictable, having a high percentage of recurring revenues, and requiring specialized technology platforms and proprietary payment acceptance networks. At its core, FLT enables their customers to optimize their own spending.
In late 2019, the Federal Trade Commission (FTC) filed a complaint against Fleetcor, alleging they had made false fuel savings promises and deliberately hid fees from customers. Uncertainty from the lawsuit, negative impacts from COVID-19, and an emerging concern from investors about the fuel card business as EV penetration increases all led to poor stock price performance. FLT was down 36% from 2019 into YE2022, underperforming the S&P500 and WEX by ~500 bps annualized.
The FTC case was closed in June 2023 with only injunctive relief requiring better disclosures and a negligible impact on financial performance. COVID-19 pressures on the fuel card, lodging, and tolls business look to have been transient, with FY2022 data showing a recovery to ~115% of 2019 revenue levels. Finally, the concern about the long-term value of the fuel card business is overblown, and they continue to invest in additional B2B payment capabilities, diversifying the franchise. Current market expectations still reflect some of these overhangs, which feels too punitive.
My base case fair value estimate is $400/share, implying a 10Y IRR of ~15%. In my view, the current share price represents an attractive entry point for owning a niche payments business led by a strong owner-operator (Ron Clarke) that also owns 5.5% of the company.
I’m still figuring things out, so feedback/comments on my assumptions or any analysis I have here is appreciated. I can be reached at icemancapital@gmail.com. Please see below for my DCF model, where you can find all of my key assumptions in the base case.
Introduction to Fleetcor Technologies
Fleetcor Technologies (FLT) is a global business payments company, and its solutions can be broadly grouped into two buckets. The first is employee spending on operational expenses, such as when an employee utilizes a fuel card to refill a company-owned or operated vehicle. The second is corporate payments, such as when FLT can enable a customer to automate its accounts payable payments process to pay suppliers or other vendors. For the second bucket, there is often a distance between the group/individual completing the spending and the authorizer or group eventually making a payment. The former spend occurs on a more decentralized basis, and the latter occurs on a centralized basis, resulting in distinct requirements for each product to provide value to its customer base. The common thread between the businesses is that spending tends to be regularly recurring and relatively predictable over time. Exhibit A shows the historical revenue breakdown over time. As reinvestment opportunities have become more limited in the fuel market, the company has prioritized growth in non-fuel markets, diversifying the business.
While FLT serves customers in more than 165 countries, 85% of revenues last year came from the United States, Brazil, and the UK. In 2022 the company began to report revenues and operating income under a slightly different definition which I show in Exhibit B. The company’s origins lay in the Fleet business, which has the highest operating income margins of any segment in its portfolio.
History
Fleetcor’s history goes back to predecessors starting in the 1980s when fleet card acceptance networks were initially being built to meet the needs of commercial customers. On the supply side, truck stop networks were rapidly being scaled to meet over-the-road fleets (OTR) requirements, including higher canopies, high-speed pumps, dining and shower facilities. Major oil companies also created larger networks and benefitted from increasing card acceptance trends. Cardlock networks which are unattended and generally located in industrial or commercial areas also grew during this period.
In 1985, the Fuelman network was created with an initial focus on individual merchants but then expanded to include regional and national brands. At the time, they entered into franchisee agreements for 20 years, allowing their partners to access their payment technology. In return, they could sign up local/regional operators or gas stations in their markets. These partners would then pay back 5% of the total spend, a very high rate back to the FLT partners. Then, 10% was paid back to Fleetcor from all this revenue. The merchants generally saw higher volumes and spending, and FLT, in turn, received steadily growing royalties.
However, the economics for partners didn’t turn out to be as attractive as they had planned, and the majority of partners were close to or losing money at the time. The strained franchisee economics limited incremental growth prospects. At the same time, investment in maintaining and improving its payments network and at least some balance sheet mismanagement led to FLT itself being very close to bankruptcy. This led to Summit Partners injecting $45m into the business and the introduction of Ron Clarke to turn around the operations. They capitalized on an option within the initial agreement with franchisee partners that allowed them to acquire them at ~3-4x multiples of EBITDA. They also pursued a strategy of adding more regional and national convenience stores into their fleet program. Then through centralizing many functions and adding scale through the acquisitions, they were able to improve profitability.
In 2006, Bain Capital invested $75m into FLT, allowing them to acquire KeyFuels, a UK-based fuel card business. Keyfuels provided them with a European base, which they utilized for additional acquisitions of Abbey Fuelcards, CSS, ICP Smart Concepts, the FuelCard Company, and Petrol Plus Region. At this point, though, they didn’t lose full focus of the US market and won a contract with Chevron in 2007. Advent invested an additional $46m to support European expansion, which led to the launch of the BP Mastercard and the Fleetcard web portal. As the economy softened in 2009, it bought Corporate Lodging Consultants, eventually becoming the basis for its current lodging segment.
In 2010, FLT went public on the NYSE. Consolidation activity in new geographic regions continued into the mid-2010s when eventually, they began to expand their corporate payments portfolio. Sem Parar, its Brazilian Tolls business was acquired in 2016 and in 2017 FLT acquired Cambridge Global Payments which added international FX B2B capabilities. In 2019, it completed the acquisition of Nvoicepay, an AP automation provider; Sole Financial, a payroll card provider and Travelliance, an airline lodging program. In 2022, FLT acquired Accrualify, an AP software firm – pretty much since the mid-2010s, incremental capital was spent on “Beyond Fuel” aspirations, leading us to today, where most of the revenues are from non-fuel card sources.
Business-to-Business (B2B) Payments Market Overview
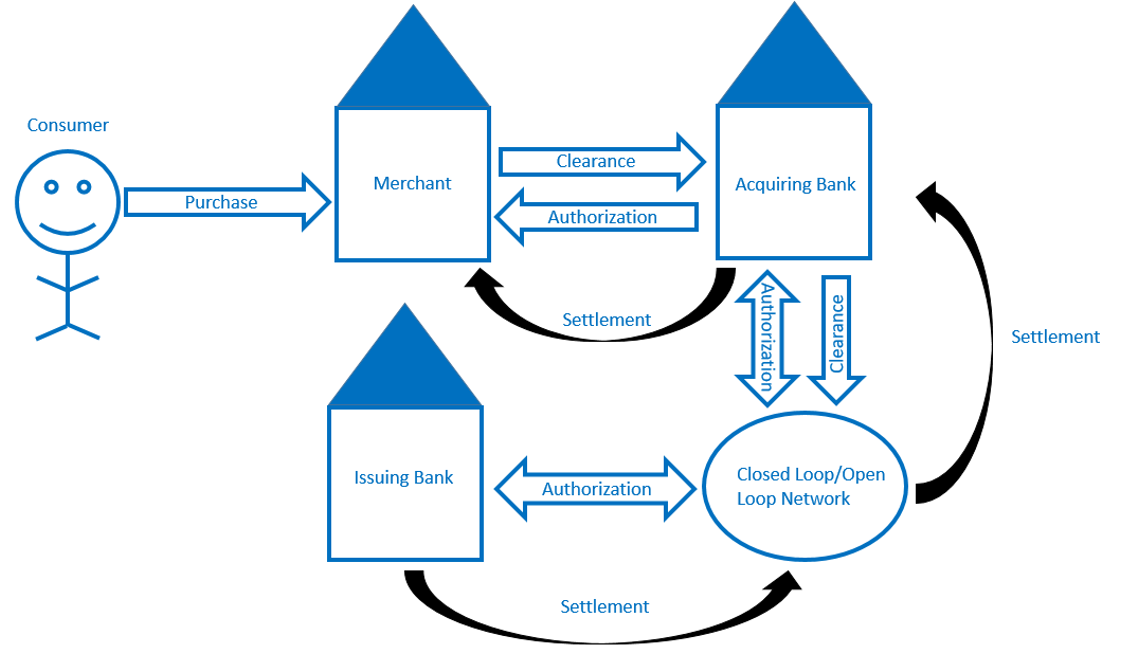
Before we get into a detailed description of payments, I think starting the conversation with how a typical consumer-to-business payment works makes sense. In Exhibit C, we can walk through the major steps needed to complete a transaction—initially, the cardholder swipes/taps at a merchant’s point of sale terminal. The merchant then sends a clearance request to its acquiring bank, which is passed onto the network and eventually to the card issuing bank. The issuing bank then approves or rejects this transaction through the network. The card network will finalize the calculations (including tip or finalized amount) and enable the issuing bank to pay the acquiring bank/merchant. What the consumer sees is effectively an instantaneous transaction, but in reality, it takes a few days if you include the settlement period.
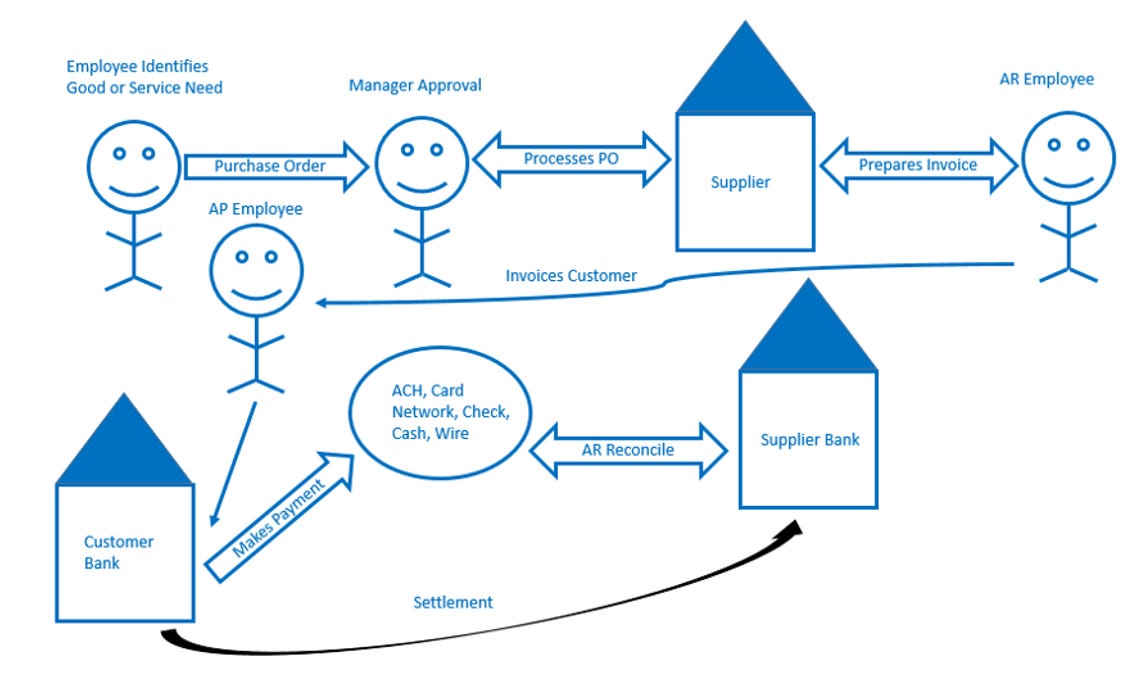
Exhibit D provides an illustration of how a typical B2B transaction occurs. Employees will initially identify a product or service they want to purchase and seek manager approval to complete that transaction. After getting approval, a purchase order is sent to the supplier. Once the purchase order is processed or fulfilled, the accounts receivable department of the supplier will send an invoice to the customer. The customer’s accounts payable department will then review & reconcile the final invoice with documentation from the supplier’s accounts receivable department. If approved, the AP department processes the invoice, and a payment is made to the supplier’s bank. A B2B transaction can easily take 30 to 90 days to complete, substantially longer than a typical C2B transaction which is usually ~2 days. In general, there are many more touch points in the B2B space due to the required checks & balances involved with what are usually large transactions.
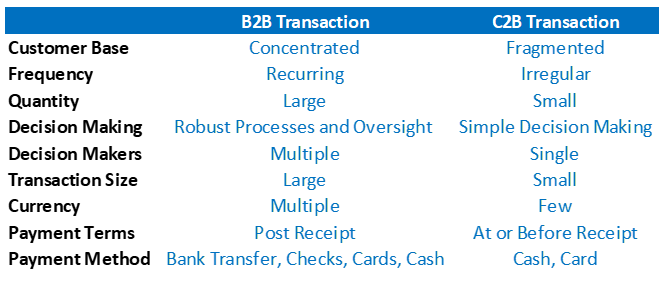
Exhibit F provides a simple comparison of how transactions between these two categories differ. The processes most businesses utilize to pay other businesses involve more steps, more time, and, as we will touch later on, a higher share of cash/check which are much more manual payment mechanisms. B2B transactions often involve payments through multiple networks and currencies. In contrast, a C2B transaction may only occur in a few payment methods and likely one currency where the consumer is located. Contract terms for each B2B transaction may also vary depending on the significance of the customer or supplier but are very likely standardized for C2B transactions. The biggest differentiator is likely that multiple decision makers and checks/balances are in place for B2B transactions where a CFO, Controller, or Accounts Payable Clerk is eventually responsible for making approvals and payments. The average size of a transaction is much larger for B2B transactions, and B2B markets often involve a formal contract between two parties. Products are usually received first in B2B markets and then paid for, while it is often concurrent for most C2B transactions.
The B2B market where FleetCor participates is ~3-4x the size of C2B markets. MasterCard estimated the B2B market was $25T for North America and $125T globally in 2017-2018. This TAM isn’t necessarily entirely relevant to FLT, but I’ve shown in Exhibit F that a significant share of B2B payments are still being made by check & cash. The B2B market is still very check and cash-heavy because ~50% of transactions are invoiced on credit and business owners have historically been comfortable with these payment methods. There have been few catalysts outside of COVID-19 to accelerate this shift materially. SMB owners are also typically unaware of the hidden costs associated with these payment methods and have historically reinvested little into researching the market for better alternatives. Intelligence Insider data in Exhibit F shows that 43% of B2B payments are still made through cash and check and is well above the 19% percentage of the C2B market. Large businesses likely represent >50% of the payment flows. However, a big opportunity for payments companies remains with small businesses where >70% of invoices are manually processed and paid by many hand-signed checks.
Fuel
The Fuel segment provides two major offerings: (1) payment solutions to businesses and government entities that own or operate vehicle fleets and (2) program management services to major oil companies, leasing companies, and fuel marketers.
FLT’s payment solutions don’t just facilitate flows – they also provide customers with consumption data, give them controls to limit spending, and simplify reporting and billing. More importantly, FLT can aggregate buying power, negotiate discounts with suppliers, and share some of these savings with their customers. Essentially, they’re pursuing a shared scale economies strategy, which matters for fuel but can also extend to non-fuel purchases like oil, filters, washer fluid, etc. In select regions, they also offer maintenance services or, in the case of Brazil, indirectly provide an insurance product.
FLT utilizes 15 proprietary payment networks comprised of +80,000 sites to fulfill this demand. In addition to these proprietary networks, they use the MasterCard and the Visa network in select areas. Given the scale of this network, they are uniquely positioned to meet the local, regional, and national needs of their customer base – you can think about this like the one-stop solution for customers regardless of size. FLT enabled >11b annual gallons of fuel pumped globally in 2022, which would have represented ~8% of all the gasoline the US consumed in 2022.
The company’s second offering - program administration services - also benefit from scale. This solution allows an oil company or convenience store operator to outsource all its sales, marketing, credit, system management, and administration of their entire fleet card portfolio. Through the aggregation of customers, FLT can spend a lower proportion on building and maintaining systems than customers would if they had attempted to replicate these capabilities in-house. The same benefits are realized from Fleetcor’s investments in physical and digital distribution.
FLT’s relationships on the supply side (gas stations) are critical in creating the overall proposition on the demand side (fleet operators) – you need both sides at scale to create value for both partners. The benefit for the locations included will be more volumes at the expense of price per unit. So as long as FLT can actually bring volumes to a site operator, the overall economics of partnering with FLT can still be accretive. Convenience store operators generally have high margins in their stores vs. on the pumps, so even if a small proportion of the incremental fleet customers come to purchase food, drinks, or other merchandise, it can benefit store profitability. For fleet operators, a lower price per unit of fuel is an explicit benefit. At the same time, simplified administration and reduced fraud are harder-to-quantify benefits that are still important in the overall value proposition.
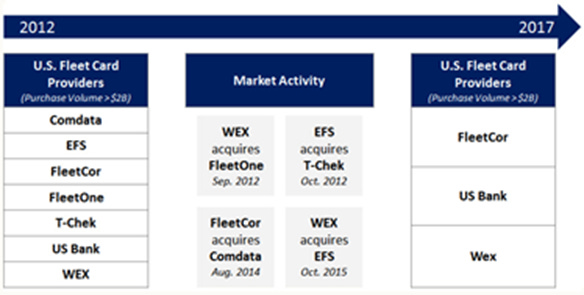
Shifting to competitive dynamics in the Fuel Card market, we have generally seen consistent consolidation trends globally – but this phenomenon has been most extreme in the US, where the market had >7 major competitors in 2012 but by 2017 was left with only ~3 major players, as shown in Exhibit G. U.S Bank owns the Voyageur Fuel Card offering which skews towards government fleets and is an area where FLT/WEX rarely compete. Additionally, there have been reports that U.S. bank has stopped investing in this product line, turning the market effectively into a duopoly. Today, this appears to be the least competitive market they sell into, and operating income margins of >45% seem to suggest the same.
FLT’s customer base skews heavily towards small or mid-sized customers where fuel card penetration remains low – while for WEX, its primary competitor, its portfolio skews towards large partners where incremental penetration gains should be much more difficult to achieve. For the over-the-road (long haul) trucking market, penetration of fuel cards is >90% and >60-80% for medium to large-sized fleets. There appears to be limited evidence that this duopoly will be disrupted as well – even with the recent entrance of upstarts like CoastPay, AtoB, and Motive, neither has seemed to gain critical mass or be able to compete on a discount or security basis meaningfully. The medium-term outlook for the business appears attractive, given limited competitive pressures and highly probable penetration gains with SMB customers going forward.
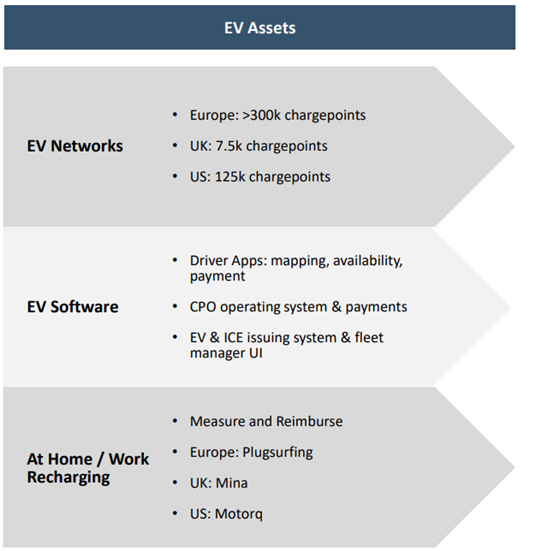
Despite the solid state of the segment today, investors are right to look out into the future as to what a portfolio of fuel cards could be worth. From now on, mixed fleets seem like they will be very prevalent and will create complexities that some operators are not yet prepared to deal with. With legacy ICE assets, they will need to use fuel cards as they do now, but with EV assets, the customers will need help to find, pay and report on the usage of public recharging transactions. Also, recharging a fleet asset at home becomes possible, but employees are only likely to commit to this if a smooth reimbursement process is accessible. FLT has had the foresight to recently assemble a portfolio of EV Charging networks, EV Software and At-Home Recharging capabilities to help manage any fleet portfolio customer. Exhibit H shows the key assets in this portfolio.
A few corporates, including Virgin Media O2 (UK Telecom), seem to have bought into this value proposition. Fleet transitions are remarkably early – Virgin O2, for example, has bought just 400 EV vans, and the overall size of the fleet is 4,300 vehicles today. As this gets converted, it should create incremental opportunities for this part of their portfolio. There would be offsets as the uptake of EV penetration would cannibalize fuel card volume demand over time. So while there are some positive anecdotes here, ultimately, there is some uncertainty as to what the economics will be for them, and despite being pushed by the sell-side repeatedly on recent calls for details, they have yet to outline any detailed explanation of the economics. Its great management has been proactive about building a solution for them, but far more difficult to get comfort that the future economics of this business will be nearly as attractive as the legacy fuel card market, especially as competition from charge point operators, utilities, and other competitors seems to be abundant.
Corporate Payments
Corporate Payments is the next largest segment, representing 23% of revenues and 18% of operating income. FLT’s portfolio of solutions here aids businesses in streamlining back-office operations and making payments to different vendors. A customer can save time, reduce processing costs, and manage payment flows more efficiently using these solutions. They offer Accounts Payable (AP) automation, virtual card issuance, cross-border payments, purchasing card, and Travel & Entertainment Cards.
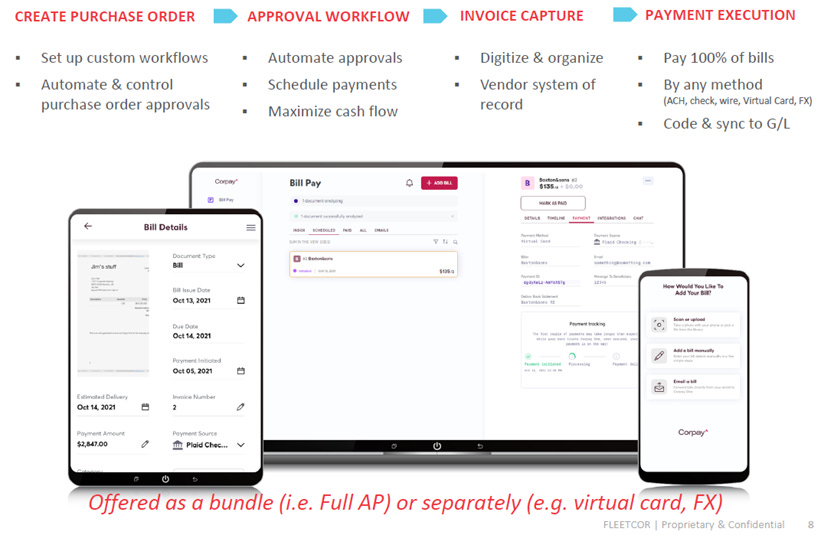
Starting with its Accounts Payable automation offerings can allow a company to automate its entire AP process, including domestic and international payables – an illustration of this is shown in Exhibit I.
Their systems allow a simplified way to scan invoices through prebuilt workflows and integrations with accounting systems like QuickBooks, commonly used at SMBs. For larger businesses, Fleetcor’s mid-market offering provides more capabilities, including thorough approval workflows, bank account data, on-demand reporting, and integration into major ERP offerings. Like other software or integrated tools switching costs are meaningful in that they can disrupt current operations and may require retraining of the employee base.
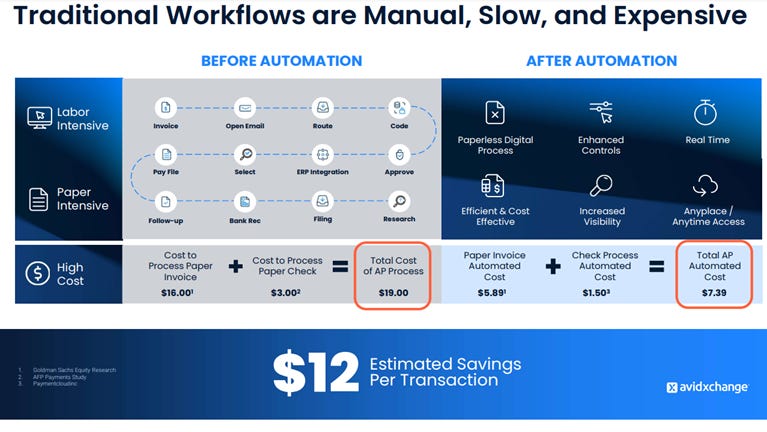
Given the attractive nature of the market, competition levels are likely to be in flux at some point. Competitors like AvidExchange have historically skewed towards the mid-market real estate sector, and Bill.com has skewed towards small businesses. Both of these rivals have begun to branch out from their initial focus areas, Bill beginning to go upmarket and AvidExchange diversifying its exposure into other sectors. But, the reality of it is that most of the AP automation offerings in the marketplace are not that differentiated relative to each other. Potential customers select an automation solution based on ROI (broadly similar), followed by ease of implementation and possible mitigation of execution risks. Several experts on Tegus confirm this as a priority over having a superior API set and software stack, which might only become highly sought-after characteristics with larger enterprises with more complex needs. Even then, with an estimated $12 per savings per transaction through automation, as shown below in Exhibit J, there might be enough potential penetration gains that drive growth for all players well before competition levels become more intense. For now, the value proposition is attractive, and penetration gains should drive attractive levels of growth for all players – but we won’t ignore the potential risks of this changing at some point down the road.
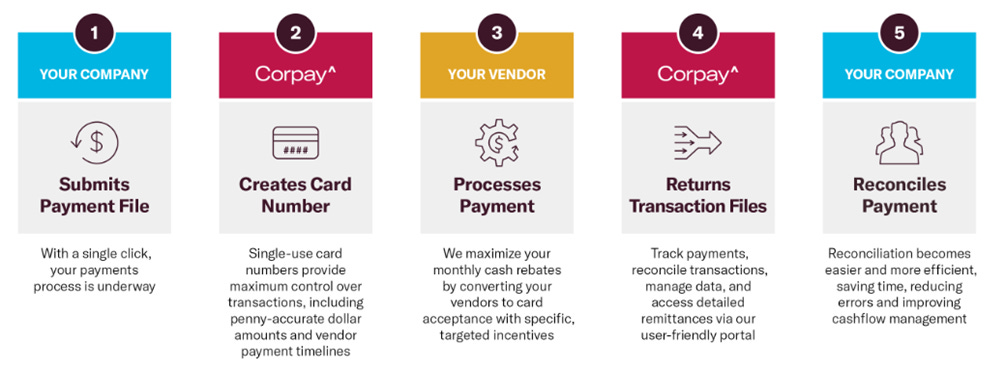
FLT’s scale in issuing virtual corporate cards in North America is unrivalled. They were most likely one of MasterCard’s largest partners, enabling $36b in virtual card payments last year, and were ~30% of all virtual volumes. Virtual cards are an unusual product compared to other payment methods, as each card is typically single-use for a specific amount or timeframe. Virtual cards are only accepted when a vendor accepts this as a payment, and an individual negotiation involving setting the Merchant Discount Rate (MDR) is part of the process. FLT’s acceptance network is estimated to be ~2-3x the enrollment rate relative to industry levels and about 4x the size of AvidExchange’s network. Another benefit for corporate customers to utilize a virtual card for payments is that they can capture some of the interchange fees in return. FLT highlights it has paid +$800m annually to customers in rebates as spend goes through this offering. So for many companies, there are benefits on the cost side as efficiency benefits are realized, a revenue benefit from rebates, and a harder-to-quantify but still valuable benefit from having fewer security-related incidents. Exhibit K below highlights the major steps involved with virtual card usage for customers.
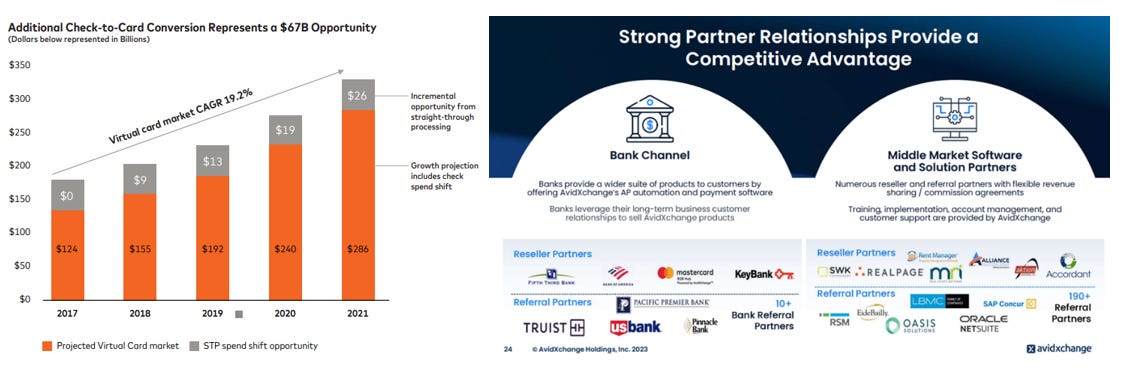
Longer term, it certainly seems difficult to know who the clear winners are in the corporate B2B payments market over time at this point, given the substantial fragmentation and potential risks of Mastercard/Visa increasingly speaking to opportunities in B2B markets, as shown below in Exhibit L. The launch of real-time payments network like FedNow could also add risks or displacement potential to parts of the overall offering, which I might not be able to envision yet. ACH has taken the majority of cash/check conversion in the past five years while card spend is growing too; it has been at a slower rate. MasterCard has increasingly been discussing B2B opportunities as part of its Value-Added services portfolio and highlighting an automated payables solution on which they partner with AvidExchange. Barring the realization of these risks, I’d think the outlook is attractive for now. They have a full suite offering in B2B payments, a long list of SMB customers who could potentially utilize this product, and tailwinds from the ongoing shift from checks/cash to cards.
Lodging
FLT’s lodging business was one of the first accommodation networks in the US to provide pre-negotiated rates to customers for B2B customers. Over time, FLT built out additional offerings for different sectors to help airline workers, passengers, and insurance policyholders who may be temporarily displaced from their homes. Its ability to efficiently serve the airline and insurance industry has led them to scale to >$100m in revenues for each vertical in 2022. FLT’s portfolio of solutions has expanded through acquisitions, including Roomex, Levarti, ALE Solutions and Travelliance – each added scale, sector expertise or technology capabilities.
They primarily use their proprietary hotel network to fulfill customers’ needs. Like their Fuel segment, FLT provides comprehensive reporting, control, and audit services. Similarly, they pursue a shared scale economies strategy, which allows them to negotiate ~40% discounts and pass on a portion of this lower pricing to the customer base. FLT was estimated to book >37m room nights in 2022, which is quite meaningful in absolute terms. The nature of these bookings is also very low risk as a corporate customer bears the cost, and the solution is a need, not a want which could be delayed/rescheduled if preferences change (which is what can happen with discretionary leisure travel). The business can provide a highly certain improvement to occupancy levels for hotels in its network. It’s worth noting that when the solution is needed, they are not giving the customer a wide range of hotel offerings but rather a quick & easy, cost-effective lodging option. Last year in the US, FLT believes they saved clients ~$420m in costs through its industry-leading purchasing power. Exhibit M provides a sample overview of the critical components of this value proposition.
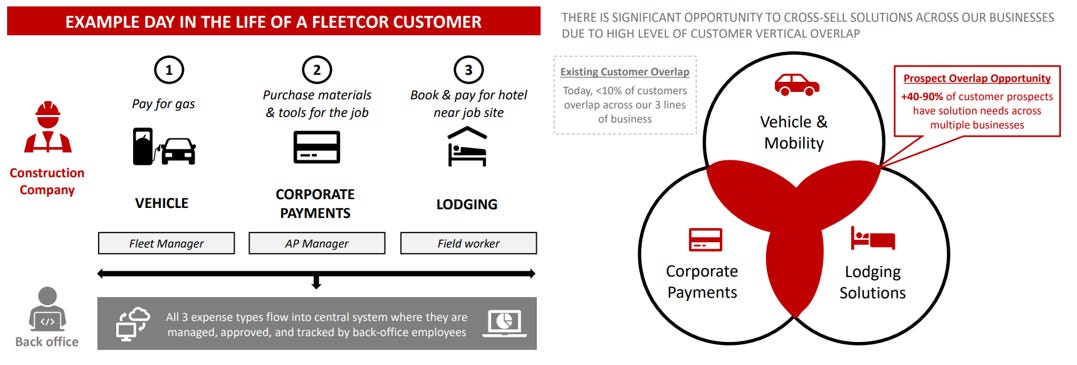
FLT’s competitive position in the market should remain solid, given its scale and integration into operational workflows. When combined with discounted pricing, the reporting, monitoring, and integrated controls create a strong value proposition for customers. Exhibit N shows how FLT has ample opportunity in the future as <10% of the customer base utilizes all three of its major solutions, but +40-90% of these customers have needs across the whole portfolio. As FLT capitalizes on this cross-selling opportunity, this should drive more volumes to their lodging network and allow them to continue growing at attractive rates over the long term.
The last major pillar in the Corporate Payments Portfolio is FLT’s Cross Border Offerings, often bundled with Accounts Payable Automation and Virtual Card solutions. Customers skew towards small to medium-sized enterprises that utilize the offering to pay international suppliers and operate foreign entities. FLT also provides hedging and risk management services to the customer base to help mitigate impacts from variability in foreign exchange rates. The company offers this settlement and payment offering through a network of correspondent payments, domestic payment networks, and technology providers, allowing them to send payments to over 200 countries and over 145 currencies. Like the fuel card offering, they also offer a white-label platform for financial institutions looking to leverage FLT investments. Scale is also an advantage here, given they are the largest non-bank FX dealer in the world, and customer satisfaction seems high as well, given +100% revenue retention last year. FLT can aggregate data from partners/customers to identify suspicious or higher-risk transactions. The biggest concern for customers is that they are not violating any major regulatory rules, and FLT can invest in infrastructure to mitigate the potential for violations or fines. The acquisitions of Global Reach Group and Associated Foreign Exchange both improved its portfolio of solutions and geographic diversification vs. what was historically a very North American-skewed business.
A case study posted on the FLT website discusses how G Adventures ™ benefited from its Cross Border offering. This company had >150,000 customers annually and vendors located around the world. FLT helped them identify that their payment processes had too much manual intervention, which led to inaccuracies and an inefficient system. Corpay (Corporate Payments Segment) provided an automated payments solution that aggregated all payments in a home currency and then settled it into customers’ accounts in 1 amount (instead of multiple that had occurred before). Corpay then continued to work with G Adventures to enhance its payment processes. This led to creation of an aggregated payment and information file that G Adventures could use for reconciliation purposes. We show both of these processes below in Exhibit O. Upon completion of these changes; there was significantly less human intervention & manual processing needed for day-to-day operations, a clear win for the customer.
Rounding it all out, each of the significant product offerings faces differing levels of competition. But, when FLT can bundle & sell this to a customer, the potential for substantial future challenges is reduced. There is the potential for this segment to represent the majority of revenues over the long term and, through additional acquisitions, have the potential to widen the competitive position for longer-term profitable growth.
Tolls
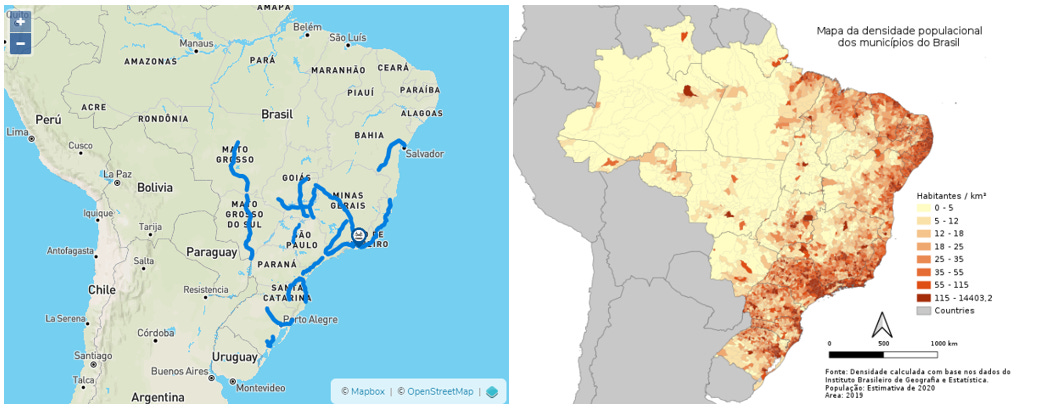
In 2016, Fleetcor expanded into Brazil by acquiring Serviços e Tecnologia de Pagamentos S.A. (STP) for $1.05b USD. They acquired this from a shareholder group including CCR SA, Arteris SA, Raizen Combustiveis SA (Shell + Cosan JV), and others. STP had near-national coverage in Brazil using its Radio Frequency Identifier (RFID) payments offering. In 2016, they processed $2.5b in payments for 4.5m users, which grew to 6.3m users in 2022. STP had 100% coverage on all roads that accept RFID in Brazil, which from my understanding, is all of the major routes and as shown below in Exhibit P, and is centralized in areas with the highest population density. The acceptance of this payment offering has expanded to include a broader range of use cases today, including parking, fuel, car wash, and quick service restaurants.
In 2018, FLT also partnered with Arcos Dorados (NYSE: ARCO), the world’s largest independent franchisor of McDonald’s locations, to include the Sem Parar acceptance. The user experience management talked about sounded fantastic. Customers must have the toll tag on the dashboard and say, “I’m paying with Sem Parar,” and the payment is completed. ARCO ran this pilot on about ~1/3rd of restaurant locations at the time, but since then, we haven’t heard much about scaling this to ~1,100 restaurants owned/operated today. Sem Parar talks about +750 drive-thru locations (QSR merchants) accepting payments today; it’s very far from having meaningful penetration across the >120,000 restaurants in Brazil.
The actual Sem Parar solution is similar to the Fuel segment in that users will pay a monthly fee to access the product. What is different is that all the spend that goes through the toll product is passed on to the merchant, and most revenues are generated from the monthly fees. FLT’s premium toll plans include the addition of 1 audiobook per month, roadside assistance, and incremental financial insurance coverage. I guess that, in aggregate, their exposures skew to middle/upper-class consumers in Brazil. The recurring income stream makes it one of the highest-quality businesses in its portfolio.
Edenred, a competitor in Brazil, is amongst the few competitors to watch. Edenred acquired Greenpass, an alternative toll payment network in Brazil, and as it is integrated with their #1 fuel card business in LATAM, it could create more competitive pressures than we’ve seen in the past. However, what is more, important is that penetration of toll products is still incredibly low at ~13%, so both players are likely able to participate in market growth from alternatives rather than compete for market share from each other.
Other Operations
FLT’s portfolio also includes two other products - a Gift Card and a Payroll Card, representing 14% of revenues in 2022.
The Gift Card operation offers complete program management and processing in 64 countries, issued under the customer’s brand name but accepted in-person or online. Adding a gift card to a merchant’s payment offerings can increase loyalty, sales, and float and generate income from breakage fees (which is income generated from balances left on gift cards that are lost or never utilized).
The company also offers a payroll card in North America, which replaces payroll checks and runs on the MasterCard and Allpoint ATM network. The wages earned fund these accounts, which can then be utilized to complete purchases, transferred into other accounts or withdrawn directly from.
This segment has had little growth over time– I’d expect it to be divested eventually, given it has little overlap with the broader B2B strategy and customer base.
2019 FTC Case
On December 20th, 2019, the FTC filed suit against Fleetcor for falsely telling "potential customers that they would save money, be protected from unauthorized charges, and have no set-up, transaction, or membership fees." The complete filing is available here if you want to read the source document. These fees are estimated to have totalled "at least hundreds of millions of dollars," covering thousands of customers. The FTC claims that the three central claims they make to customers, including saving money, fraud controls and no set-up transaction or membership fees, are all false. We'll review all the allegations and some related excerpts from the document shortly.
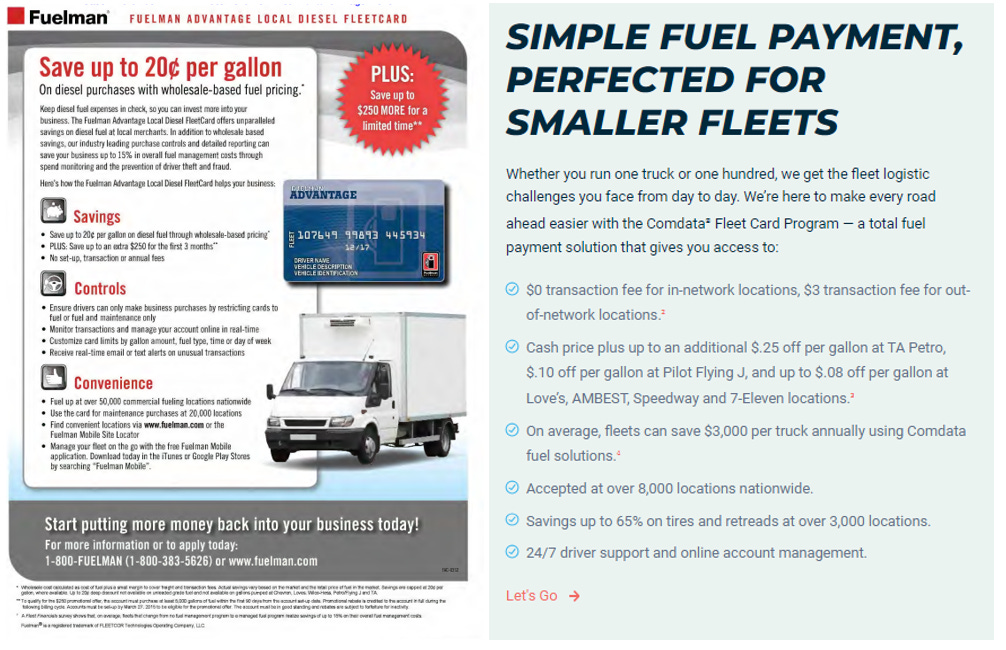
The first claim the FTC makes is that customers are not saving money, which is likely due to the fees they charge for their products. Then in reference to what I believe was a response to the Citron report highlighting a similar claim – Clarke (CEO) asked employees to calculate the total US retail discount customers are getting, but the analysis only indicated they were saving "a fraction of a cent per gallon." This is a far cry from the 20-cent claim outlined in a previous advertisement shown below in Exhibit Q. But, even today, Comdata's lowest tier offering makes similar claims in that they could help the average fleet save ~$3,000 per truck using their solutions. In my interactions with the company, they have highlighted they roughly give pricing to their fuel customers at the midpoint of the wholesale and retail price. My best guess is that customers realize some savings, but it is probably not the magnitude they advertise, and the significant reason here could be that some customers don't reach the volume thresholds required to realize the full savings potential.
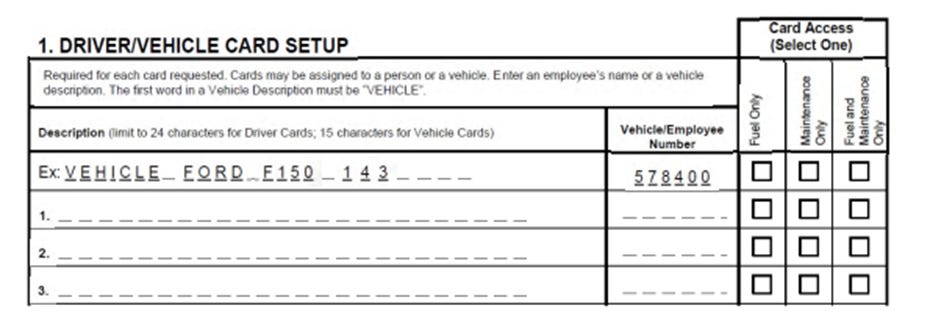
The second claim is that the cards “protect customers from unauthorized transactions.” When a customer signs up, they can select what authorizations will be set up for each person or driver. This process seems relatively straightforward, but it appears some of the controls on select cards (not all) might have been too weak on their part, allowing the sale of some additionally available merchandise (snacks, beverages, etc.) due to some internal issues. It likely stems from their network being built through multiple acquisitions and may not operate flawlessly. It doesn’t seem like they would willfully set up their systems to allow this behaviour or that it is happening on a wide scale. Another thorny issue highlighted is that with the fuel cards, the customer agrees to be responsible for all activity on the account regardless of whether they are within or outside the initial parameters set up. Most consumer cards don’t function like this. Unless a mom/pop plumber operation in your local town is rigorously reviewing the terms and conditions, it seems reasonable that they could be surprised negatively. Rounding it out, I think there are probably some cases where the initial setup goes awry, and they might sometimes hold too aggressive of a line with customers. But, I find it very difficult to think a business of this scale (>11b gallons per annum) isn’t mitigating at least some of these leakages – especially as they have begun to focus on retention rates which have drifted to the ~93-95% range in recent years.
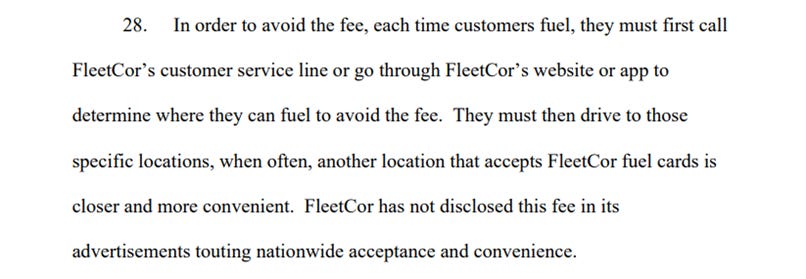
The last and final claim seems at odds with what is disclosed in the terms and conditions. A review of the latest T&C quite clearly shows many of these fees outlined as part of the overall agreement. This doesn’t necessarily mean that in the past, there weren’t some less-than-ideal behaviours at FLT – even some customers argued that the company should change its name to “FeeCor.” Experts on Tegus have discussed how the firm used to take a very aggressive approach with fees following an acquisition utilizing it as the main driver to improve profitability. Account attrition would occur as expected, but the net benefit was still positive as tight expense controls, and this shift fee mix from customers would drive margins >50%. My best guess is that many of the small and medium-sized businesses they end up signing on are just not scrutinizing the contracts before signing them – this is sort of the opposite of what would occur at larger firms where specialists would review any credit or related terms and conditions for any contract they are signing. This also seems to be why WEX has continued to win with the largest fleet operators over time by taking a less aggressive stance. One other claim is that customers need to pay per-transaction fees in select situations. A common scenario where this would occur is if a customer wants to fill up from a merchant who is not part of its preferred network. The cost profile differs as the volume is pumped from out of the network, and FLT needs to charge appropriately for that. Exhibit S is an excerpt from the case filing outlining this issue.
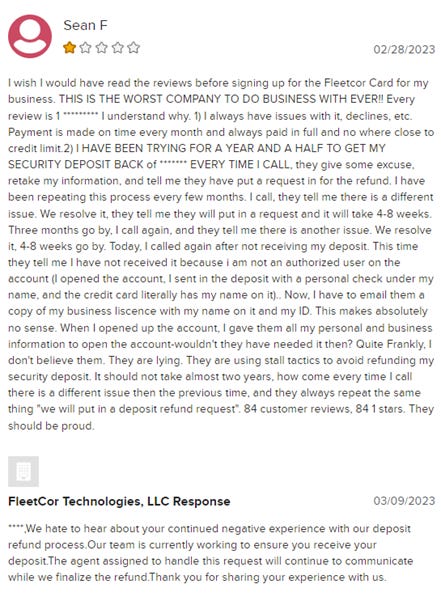
Further muddying the water is that many customers in the past have complained to the company and the Better Business Bureau (“BBB”). Ratings on the BBB website are pretty nasty, with an average rating of 1 out of 5 from an average of 90 customers. There isn’t much to counter here – this is probably far from the most customer-friendly organization, with many of their processes for dealing with customers, payments, and potential issues skewed toward the more aggressive side. However, it seems there is also a high possibility that its underlying IT systems assembled through frequent M&A lack thorough integration and may be much more prone to challenges that create errors that customers continue to report.
In response to these claims, the company highlighted that the FTC allegations were only related to the North American fuel business, which generates ~$650m in revenues. Exposure at risk would fall by 50% as about half of that is generated from interchange fees, which means 15-20 % of EBITDA could have been at risk (2023), which is a meaningful dent but a manageable situation if it were to disappear. The other mitigating factor is that over time Tegus experts have highlighted that WEX T&C have drifted towards FLT standards but don't appear to be under the same scrutiny.
Putting all of this aside for a moment and viewing the situation from 10,000 feet - most financial companies will have some complaints and unhappy customers. The public data in the release shows that complaints only occur 1x per 28,000 invoices (0.0036%) and are favourable relative to other card issuers. This doesn't scream behaviour so egregious that the company won't be able to remedy these issues over time.
This cloud was officially lifted on Fleetcor as they reached an agreement with the FTC on June 9th, 2023, which required "FLEETCOR to implement a set of disclosure practices, such as crediting customer payments on receipt date or providing notice to customers in advance of receiving a new fee. As previously disclosed, FLEETCOR has voluntarily implemented multiple disclosure enhancements to improve the customer experience." Most importantly, though, is that even with the implementation of these changes, the company does not believe there will be a material impact on the company's financial performance – which was far better than we had expected.
Management & Governance
Ron Clarke has been CEO since August 2000, before IPO, and Chairman since March 2003. He was initially brought in with the board's support to turn the business around. He definitely did this growing revenues at 19% and Cash EPS at a 21% CAGR from 2010 to 2022. A return on gross spend of ~21% over his tenure also looks excellent. Even with this strong track record, it appears he has been paid a lot over his tenure. As You Sow, a non-profit leading shareholder advocacy group, has ranked him as the 11th highest most overpaid CEO in 2022. This has been a theme in the past as well, going back to 2017, when Ron was getting paid nearly the same amount as the CEOs of Walmart and Starbucks, companies about 4-10x the size of FLT. In four of the past six years, shareholders have failed to approve the company's say on pay. Exhibit U below compares reported votes against proposed management compensation in 2022 and highlights shareholders' general dissatisfaction with either the structure and/or magnitude he is getting paid.
With only 35% of shareholders approving the company’s last say on pay (2022), the board undertook an engagement process with the largest ten shareholders and a review of proxy advisory firms to identify areas to improve. This resulted in an agreement with Ron to not receive any long-term equity compensation in 2023 – the same as in 2020 and 2022. However, in 2021 he received 850,000 performance-based stock options with stock price hurdles of $350 and $400, respectively, with an estimated fair value of $55m. Annual incentives were based on an equal weight on GAAP revenues, Adjusted EPS (excluding the impact of changes in fuel pricing, fuel pricing spreads, FX rates, and M&A), M&A (and other transactions), and Growth/Other Initiatives. Notably, an ROIC/ROE metric is missing, which could aid in driving incremental focus on underlying returns in the business. Long-term incentives are paid out through a combination of performance shares and options tied to adjusted EPS and net revenue vs. targets, but details are not disclosed. Performance shares utilized an annual performance period which is too short-term oriented, in my opinion, and the metric/target overlaps with one of the short-term incentive metrics. So, for all functional purposes, it is actually a short-term incentive despite being labelled as part of the long-term incentive bucket. Far from perfect from my perspective, but at least the CEO owns ~5.5% of the outstanding stock.
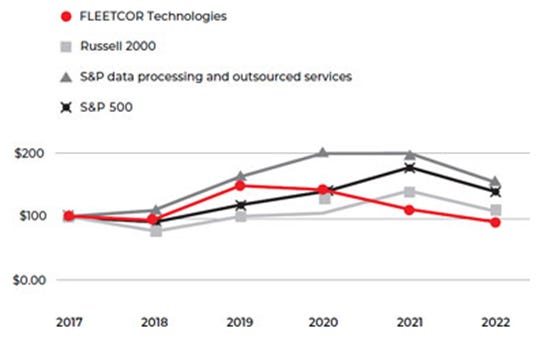
Exhibit V shows the company’s relative TSR compared to benchmarks pulled from the 2023 Proxy Statement, which shows the material underperformance they have delivered over the past five years. This is why D.E. Shaw emerged as an activist shareholder and drove the creation of a strategic review committee and the introduction of 2 new board members. Potential spin-offs or an asset sale could materially change the sentiment on the stock.
Valuation
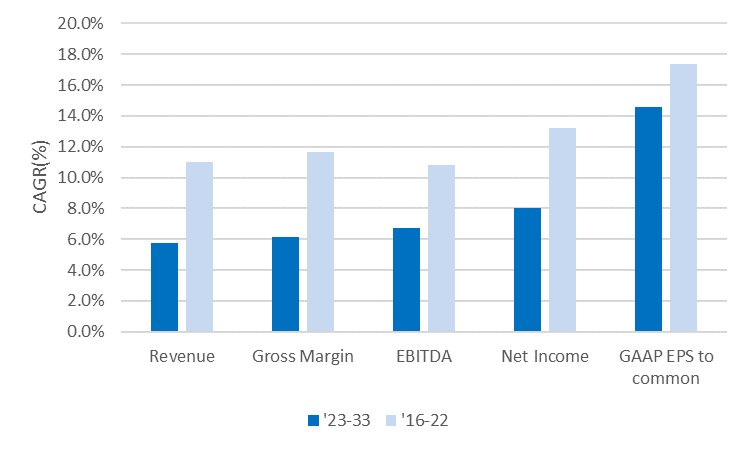
The primary driver for FLT topline growth will be through growth in the number of transactions of each segment and the revenue realized from each transaction. Above in Exhibit W, we highlight our expectations on a segment basis out to 2033, which collectively gets to a 5.8% CAGR on a group basis. Additional details on the per transaction and volume expectations can be found in the model. These expectations are far below management's guidance for ~10% revenue growth over time (including M&A).
Below in Exhibit X, we expect gross margins to be relatively flat over our forecast period, roughly in the ~80% range in-line with historical trends. EBITDA margins are expected to expand by about 300 bps through operating leverage on selling costs as cross-selling is prioritized, and G&A is optimized over time.
This collectively leads to GAAP Net Income CAGR of 8% during our forecast period, with EPS growth expected at a 14% CAGR driven by buybacks where we deploy excess cash flow in our base case. ROIC is expected to gradually improve towards 25%, largely driven by falling improving NOPAT margins and only moderate growth in invested capital base during the forecast period. Excess cash builds on the balance leaving ND/EBITDA at -0.3x in 2033, leaving ample capacity for M&A if opportunities emerge.
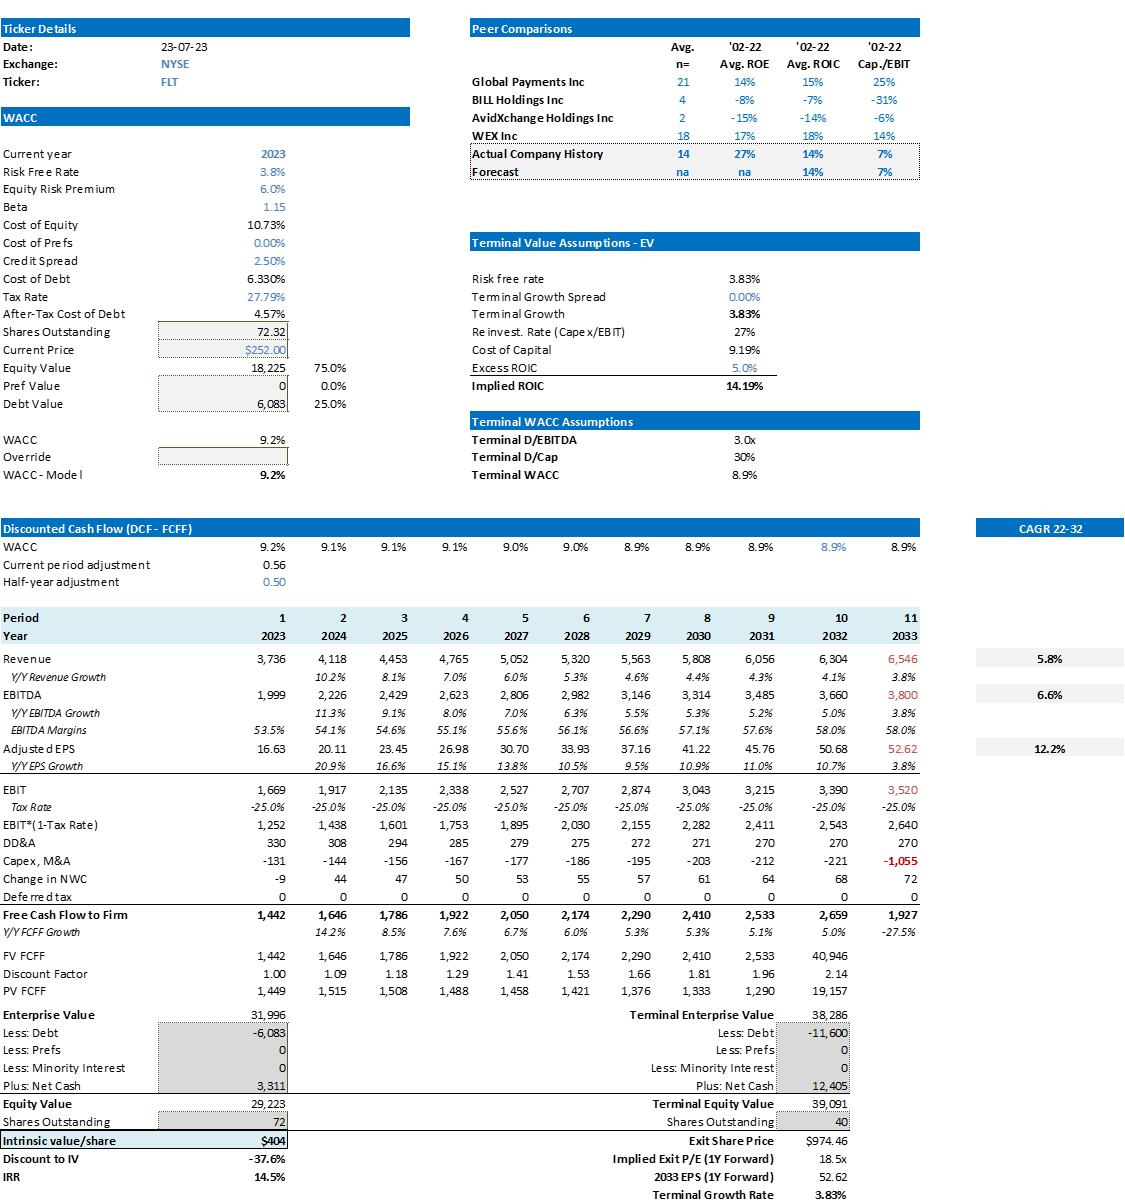
My base case suggests that fair value is $403/share, which is well ahead of the current share price of $241. Exhibit Z shows a screenshot of my DCF output tab.
Conclusion
FLT is a niche payments player with an effective capital allocator at the helm. I believe the company has cycled through the worst impacts of COVID-19, the FTC case and concerns about its longer-term positioning with its refreshed fuel/mobility offerings. I see good growth opportunities across the company’s portfolio, and through cross-selling solutions to its large customer base should be able to drive above-market-like growth for many years to come. I believe you could generate an ~15% IRR from the stock today. Alternatively, the stock trades at a 14.7x P/E, a discount to the 17.8x P/E it has traded at over the past five years, and the business should be able to compound earnings at least a low teens growth pace driving similar return expectations. As always, feedback is appreciated.

